July 11, 2022

Five pie-charts for your communications life

As development sector communications professionals, we should get an evening off to commiserate.

2 min read

1
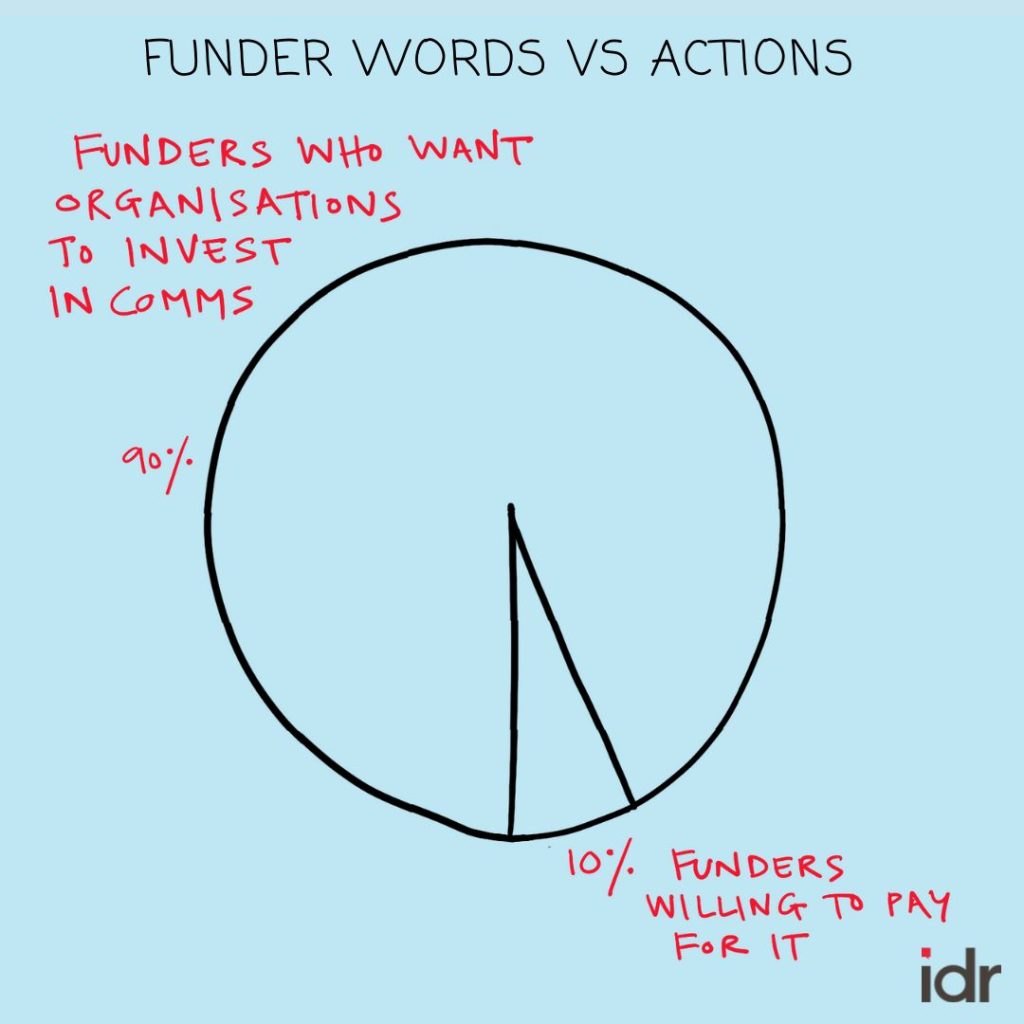
Pie chart that indicates that 90 percent of funders want organisations to invest in communications, but only 10 percent of them are willing to pay for it.

2

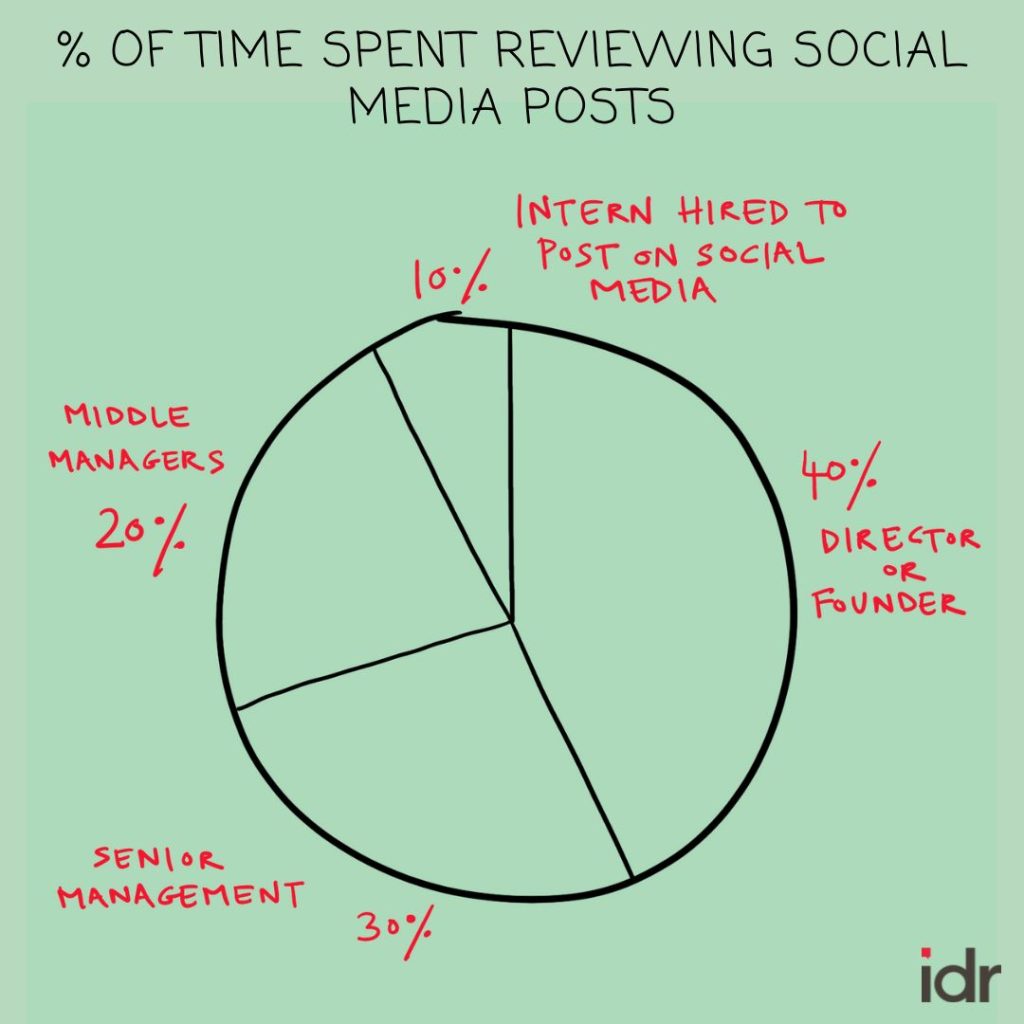
Pie chart that indicates that that director or funder spends the most time reviewing social media post, whereas the intern hired to post on social media spends the least time doing so-communications

3

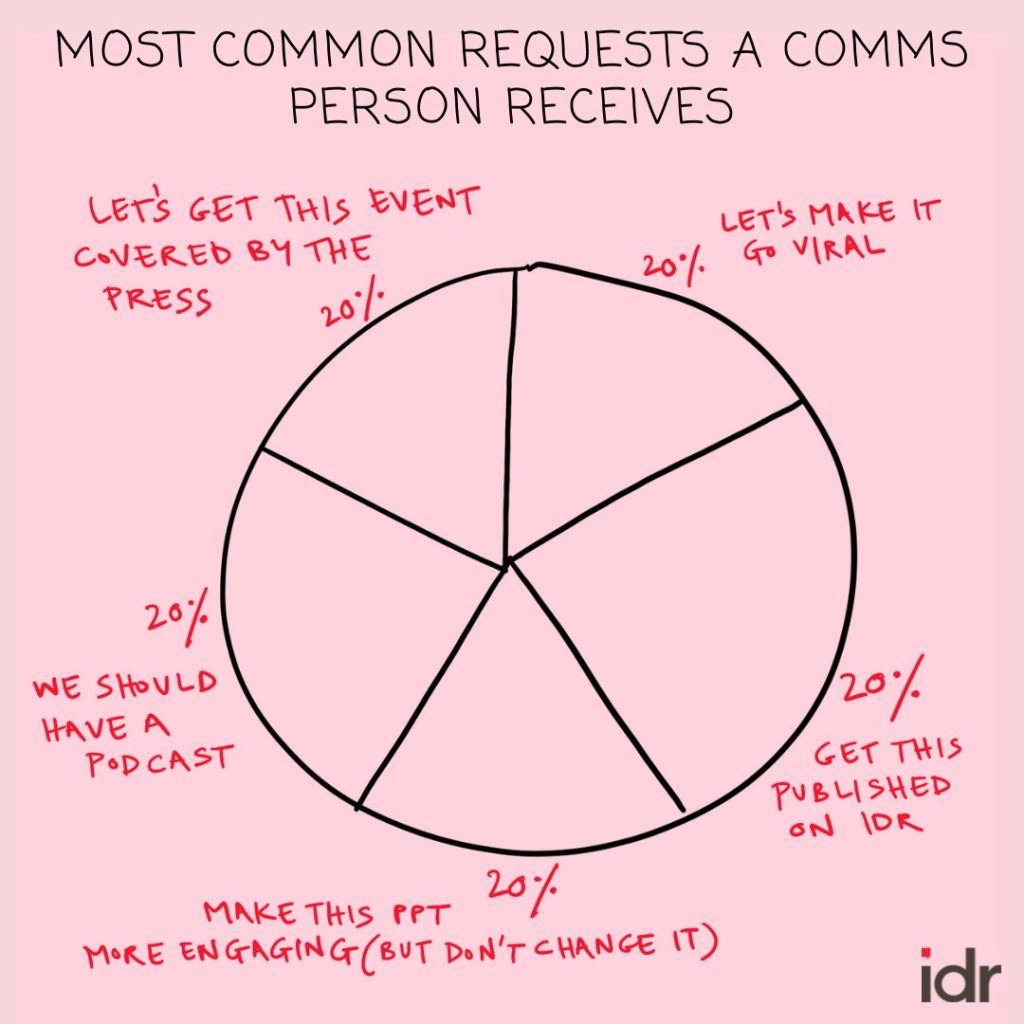
Pie chart that illustrates that most common requests a communications person receives, which include making the PPT more engaging without changing it, getting events covered by press, making a post go viral, and starting a podcast.

4

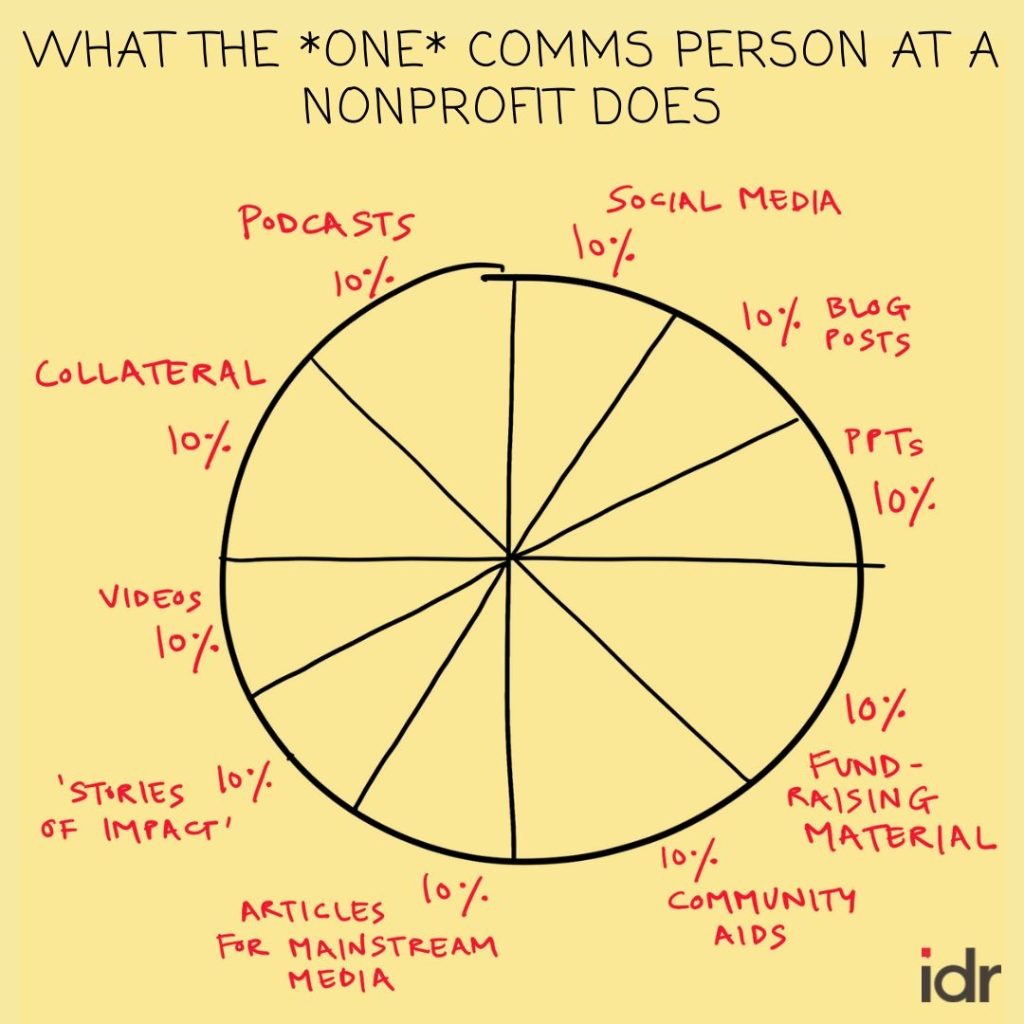
Pie chart that illustrates the numerous tasks a communications person at a nonprofit does, which include social media, blog posts, podcasts, PPTs, videos, fundraising material, etc.

5

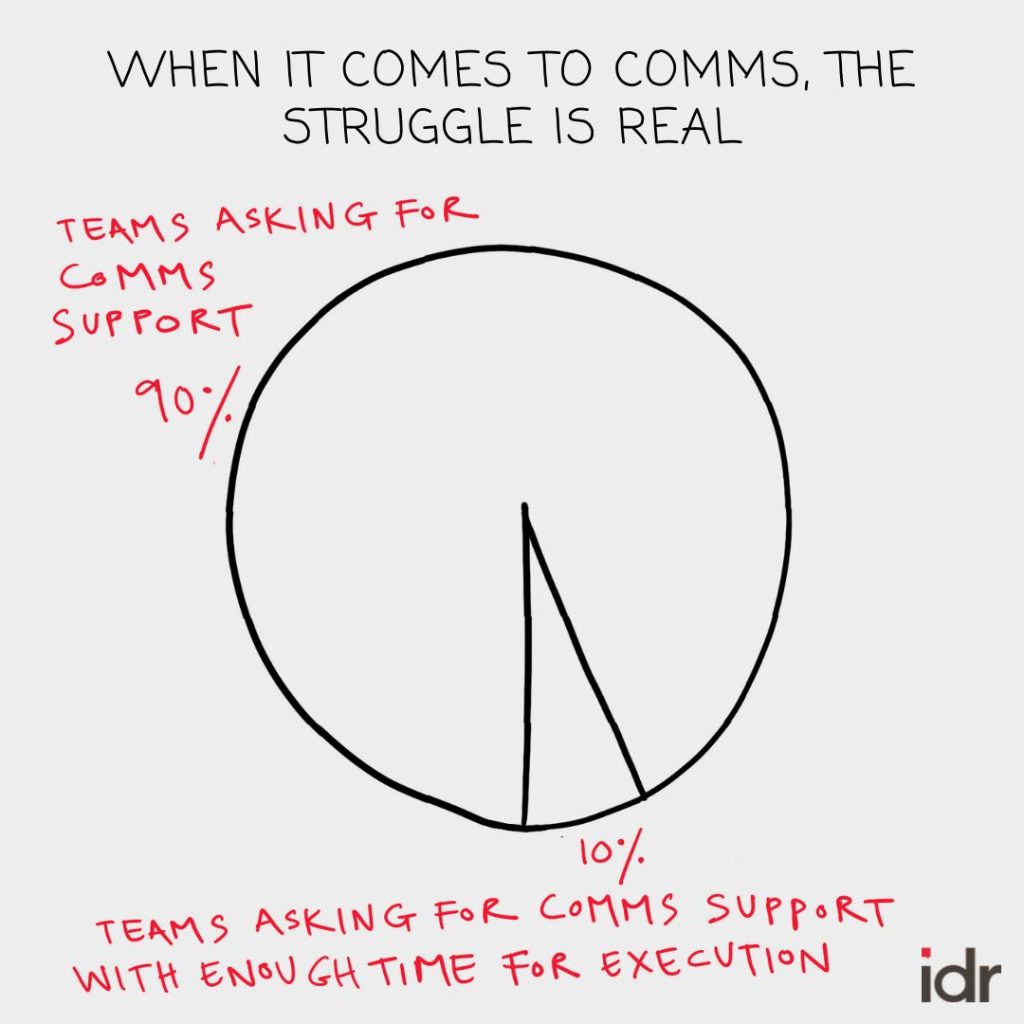
Pie chart that indicates that 90 percent of teams ask for communications support, but only 10 percent of teams ask for communications support while providing enough time for execution.
donate banner
We want IDR to be as much yours as it is ours. Tell us what you want to read.
ABOUT THE AUTHORS
India Development Review-Image
India Development Review

India Development Review (IDR) is India’s first independent online media platform for leaders in the development community. Our mission is to advance knowledge on social impact in India. We publish ideas, opinion, analysis, and lessons from real-world practice.
COMMENTS
READ NEXT