As India recovers from the pandemic and the new National Education Policy is implemented, reliable data on ‘learning outcomes’ will be crucial. In this post, Johnson and Parrado assess the reliability of India’s two main sources of learning outcomes data—the government-run National Achievement Survey and the independently conducted Annual Status of Education Report—and highlight the pressing need for better learning outcomes data.
Accurate, comprehensive, and comparable data on ‘learning outcomes’ are essential to track learning progress, hold public officials accountable, and evaluate the impact of education policies. Reliable learning outcomes data will be especially important in India over the next several years as states and the central government seek to recover from the Covid-19 crisis and implement the ambitious new National Education Policy (NEP).
In a recent study (Johnson and Parrado 2021), we use several quantitative approaches to assess the reliability of India’s two main sources of learning outcomes data—the government-run National Achievement Survey (NAS), and the independently conducted Annual Status of Education Report (ASER) survey. We show that NAS data is unreliable even for comparisons between states and that ASER is significantly noisier than calculations based solely on sample size would imply.

Our findings suggest that policymakers and analysts should be careful in how they use ASER and should avoid use of NAS altogether. They also reveal a pressing need for better national learning outcomes data. At the end of the post, we offer several suggestions for how to fill this gap.
Background on the learning outcomes surveys
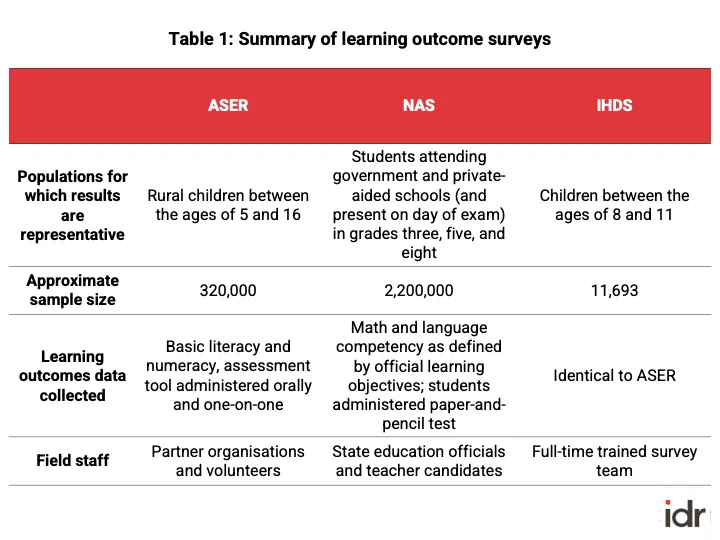
The NAS is a large, school-based assessment of student learning conducted by the central government. NAS is administered in government and private-aided schools to children in grades three, five, and eight using a paper-and-pencil test. It seeks to measure whether students have achieved grade-level learning competency.
The ASER survey is a large survey of basic literacy and numeracy skills implemented by volunteers. ASER uses a household sampling strategy to select a sample representative of all rural children between the ages of 5 and 16 and administers a one-on-one oral assessment to each sampled child. To our knowledge, ASER was the first nationally representative survey of learning outcomes in rural India and played a pivotal role in raising awareness of India’s low learning levels.
In addition to the two main national learning outcomes surveys, we also use a third dataset, the India Human Development Survey (IHDS), in our analysis. IHDS is a large, panel survey representative of all households in India that includes a variety of questions on household welfare and, for all children between the ages of 8 and 11, results from a one-on-one assessment based on the ASER survey. We use data from the second round of IHDS conducted in 2011-12.
Comparing the three surveys
We first compare the three datasets to each other to ensure that the findings are broadly consistent. Direct comparisons of raw results from NAS, ASER, and IHDS are not valid as the three surveys use different sampling strategies and NAS uses a different learning outcomes assessment. However, by restricting the samples of the three surveys to children targetted by all of the surveys (rural children attending government and private-aided schools1) and to learning outcomes comparable across the surveys (grade three reading outcomes), we may ensure that the three datasets measure similar learning outcomes for a similar set of children. As NAS, in its present format, was only conducted in 2017, we use ASER data from 2018 to maximise comparability between ASER and NAS though this means that there is a substantial time gap between the IHDS (which was collected in 2011-12) and the other two surveys.

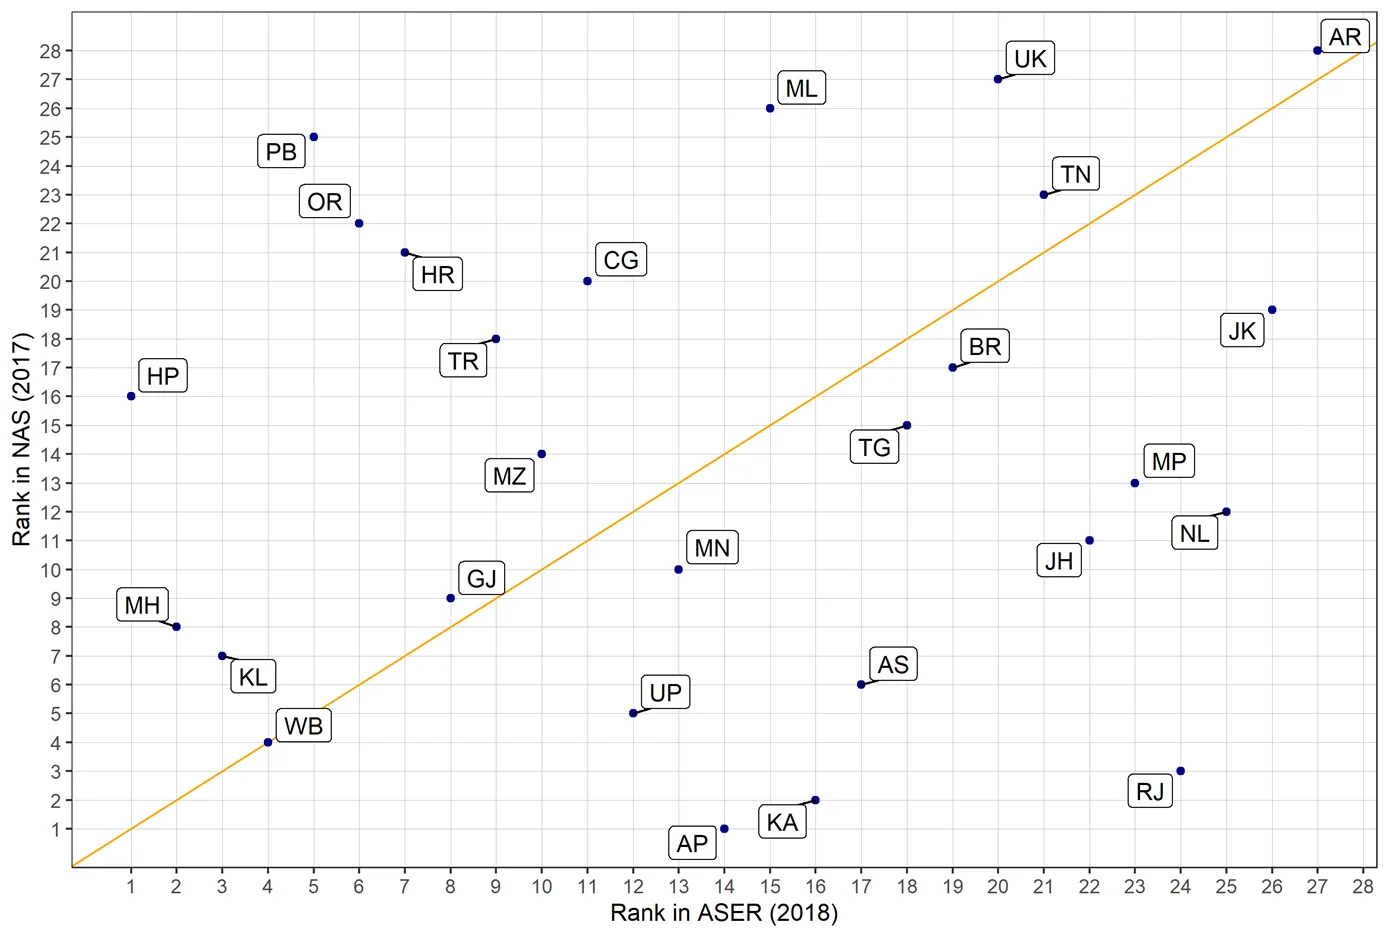
We find that ASER and IHDS state scores are relatively similar despite the large time gap between the two surveys, while NAS scores are far higher than either (Figure 1). Further, NAS state scores display almost no correlation in levels or rankings (Figure 2) with ASER state scores or net state domestic product (not shown). Based on these comparisons, we believe that NAS scores are unrealistically high and contain little information about relative state performance.
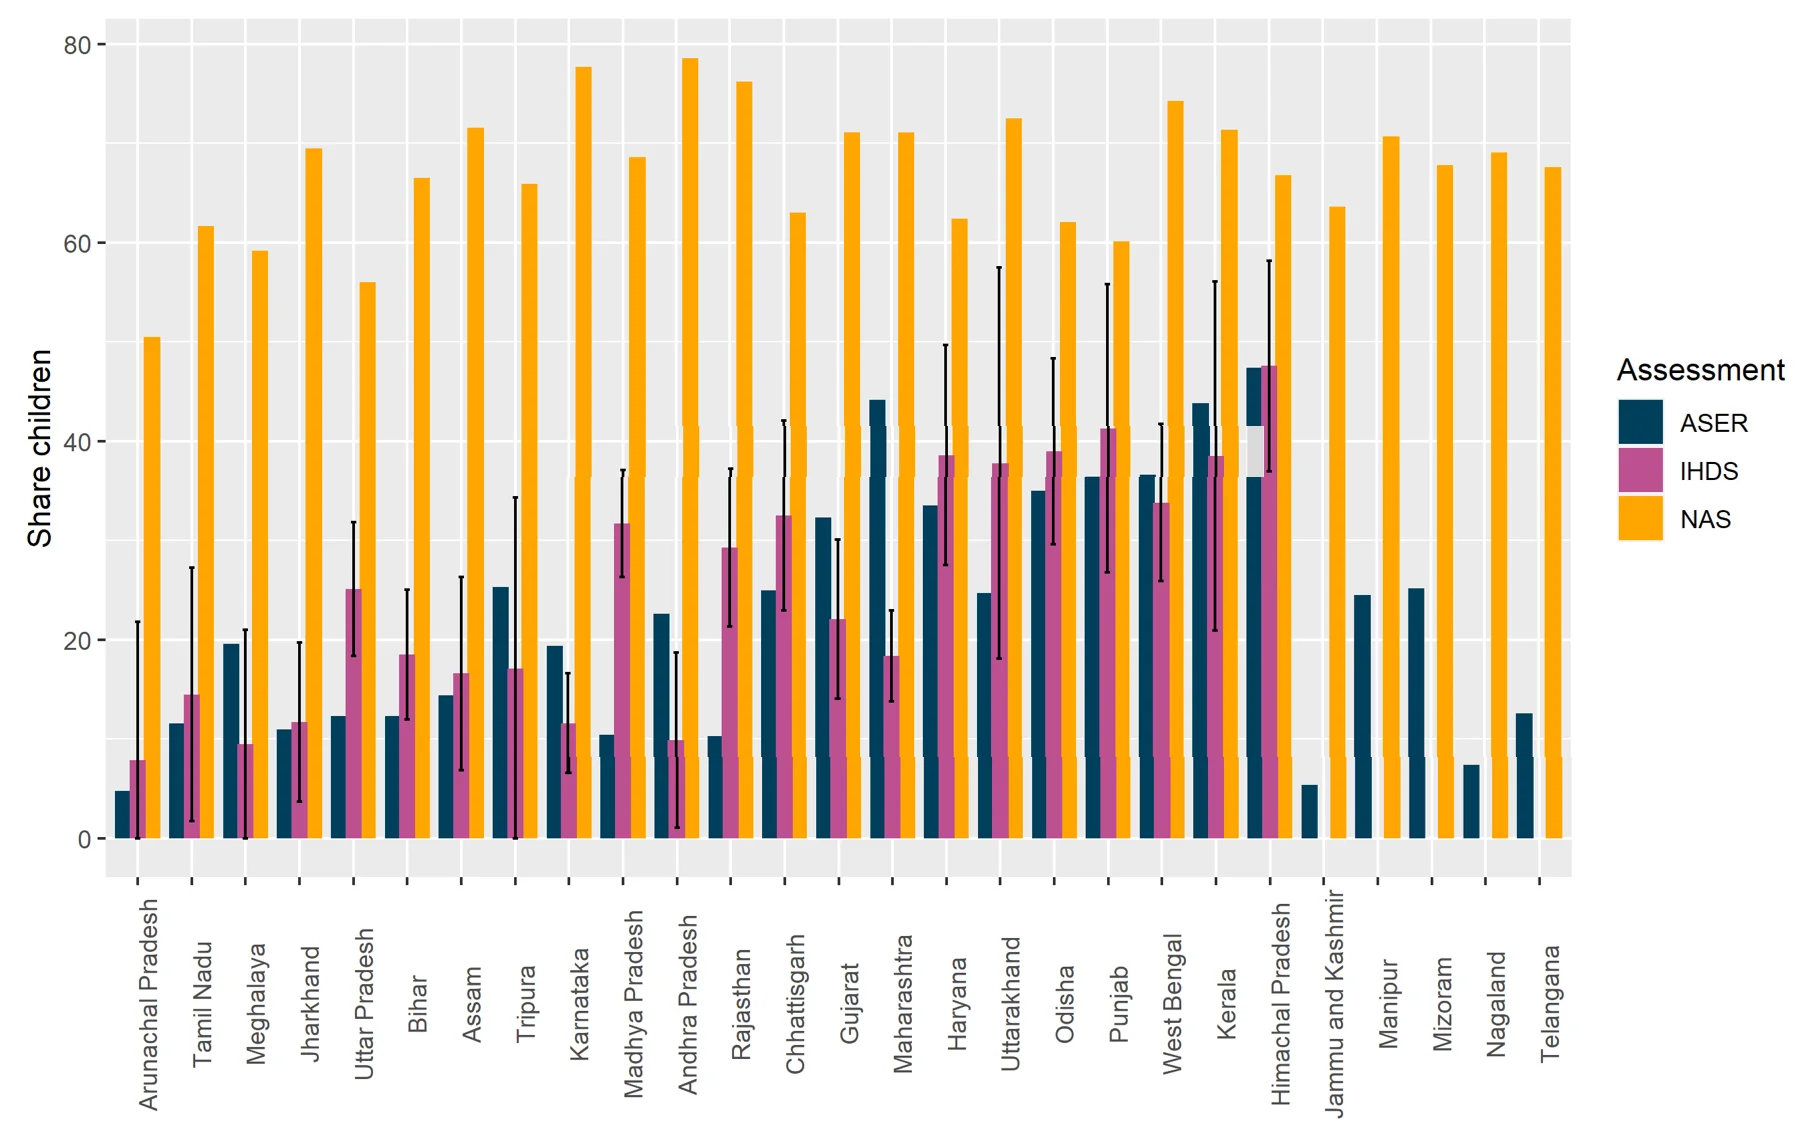
Figure 2. Correlation between NAS and ASER state ranks
Changes in ASER over time
We next assess the internal reliability of ASER data. A previous psychometric assessment of the ASER tool found that it is reliable at the student level and the comparison above with IHDS lends confidence in ASER’s results (Vagh 2012). Yet, there are two reasons to suspect that there may be non-sampling errors in ASER data. First, ASER is implemented through the assistance of partner organisations that often use volunteer surveyors with relatively little experience. Second, to sample households within villages, ASER uses the ‘right-hand rule’, in which surveyors walk around the village selecting every Xth household rather than the more accurate (but costly) household-listing method. When implemented with fidelity, the right-hand rule reliably generates representative samples but it is difficult for supervisors to monitor whether surveyors have implemented the method accurately and thus, it relies crucially on the skill and diligence of surveyors.
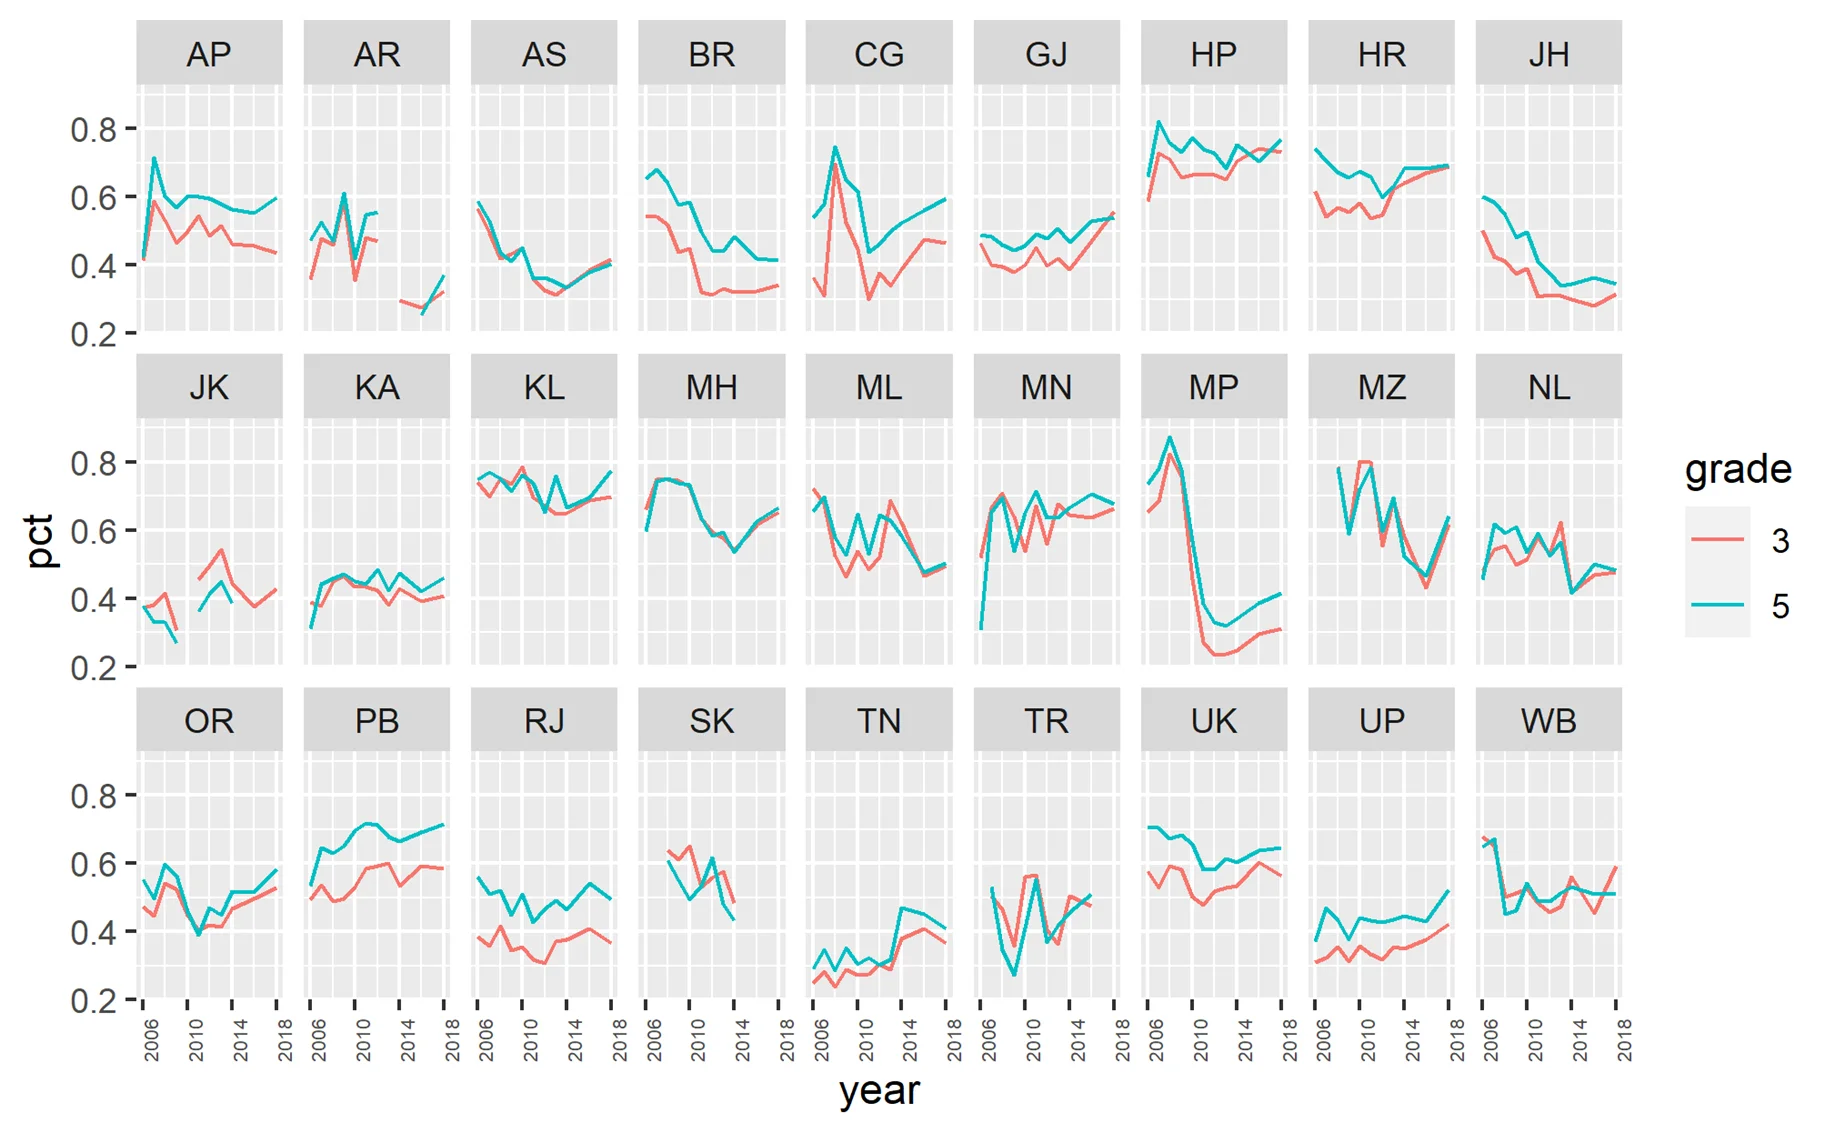
To assess ASER’s internal reliability, we use two approaches developed by Kane and Staiger (2002). Intuitively, these approaches look at whether changes in ASER outcomes in one year tend to ‘stick’ in the following year. If changes in scores tend to stick, we can be relatively confident that measured changes reflect actual changes in underlying learning outcomes. On the other hand, if changes are typically reversed, we would suspect that measured changes often reflect measurement error. We apply these methods to ASER state-level scores for children in grades 3 and 5 from 2005 to 2018, and ASER district-level scores for children in grades 3, 4, and 5 from 2006 to 20112.
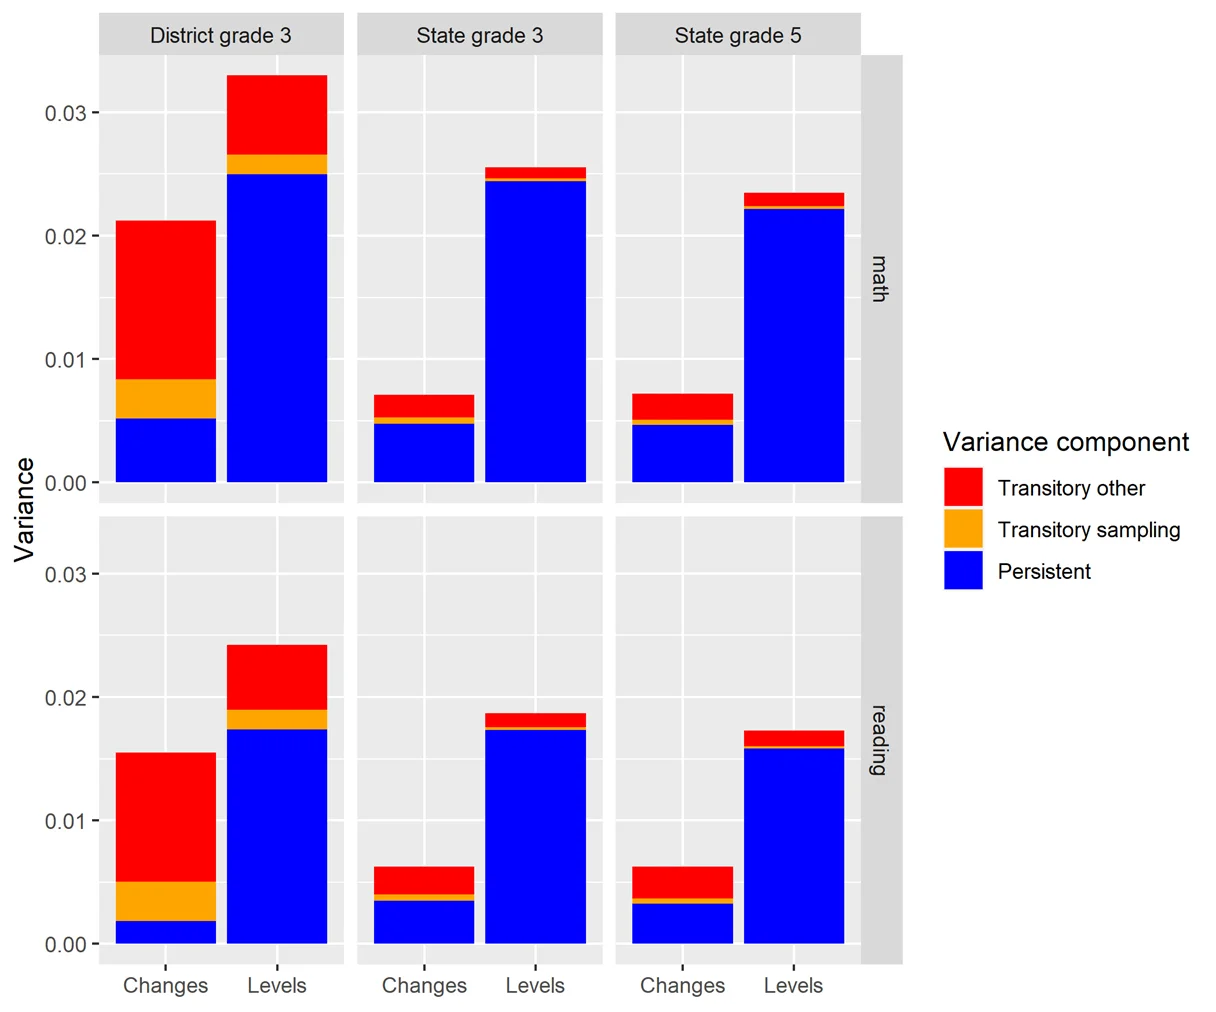
Visual inspection of ASER’s state-level reading scores over time reveals that changes in state averages in one year are in fact often reversed in the following year (reading scores in Figure 3, math scores exhibit very similar trends). Results from our quantitative analysis suggest that while most of the cross-sectional variance in state scores is due to persistent differences, between one third and one half of the variance in changes in state scores is due to transitory changes3.
State-level assessments and key stages exams unlikely to fix the problem
Our analysis assessed the reliability of the two national-level learning outcomes assessments. Several states have recently launched surveys or census-based state learning assessments. According to a recent report, 27 states and union territories conducted state-level assessments in 2016 (Michael and Susan Dell Foundation et al. 2021). In addition, the Ministry of Education plans to introduce new census-based assessments in grades three, five, and eight.
There may be other good reasons to conduct state assessments or census-based assessments4 but these efforts are unlikely to yield reliable, comparable data on learning outcomes in the short term. Data from state-level assessments are difficult to compare across states due to differences in assessment design. In addition, state-level assessments are often used to rank and reward districts (or blocks or schools), which all but ensures that the data are unreliable. For example, under the Saksham Ghoshna5 project in Haryana, blocks which achieved 80% student competency on a state-level assessment were provided official recognition. Unsurprisingly, in the four years of the project, the share of students who had achieved the competency level went from 40% to 80% (Michael and Susan Dell Foundation et al. 2021, 19).
Similarly, census-based assessments in grades three, five, and eight are unlikely to generate much in the way of usable data anytime soon. In Madhya Pradesh and Andhra Pradesh, researcher Abhijeet Singh randomly retested a sample of students who had recently taken official state-administered assessments using the same questions used on the official assessments. Despite the fact that the states implemented several anti-cheating measures and there were no rewards or punishments tied to assessment performance, Singh found that, in most cases, scores were severely inflated in the official assessments. Singh’s research suggests that it is devilishly hard to get accurate data from a census-based assessment (Singh 2020). However, we are optimistic that the central government and states will eventually find the best way to get reliable data, but it will certainly take some trial-and-error to get it right.
Reforming the NAS
Despite the issues with the NAS, it is still the most the most promising route to reliable learning outcomes data. For a learning outcomes survey to be comparable across states, it must be designed and managed by a national body. For it to be reasonably priced, it must be conducted in schools and thus, requires the endorsement of the Ministry of Education. For now, NAS is the only survey that meets both these criteria.
Several changes to the NAS are planned or in progress. The NEP recommends that a new National Assessment Centre (NAC) be created with the responsibility for administering the NAS, and providing guidance on all assessments. Furthermore, this year the NAS will be implemented by CBSE (Central Board of Secondary Education) rather than state-level education officials and will include private schools. The creation of NAC and the addition of private schools are welcome developments, and the involvement of CBSE is an intriguing approach.
Based on our findings, we recommend that the central government and other partners take several additional steps to maximise the chances of success. First, we recommend that, at least in the short term, NAS is scaled back in size to generate only state-level, and not district-level, estimates. This will reduce the required sample size for the survey by a factor of 25 thus making the data collection effort far simpler to carry out. While reliable district-level estimates would no doubt be very useful, it would be much better to only have reliable state data than to have poor state and district data. In the long term, NAS can be scaled back up once the data quality issues have been addressed. Second, we recommend that the NSSO (National Sample Survey Office) add an ASER-like assessment to one of its regular rounds of household surveys. These data may help validate NAS data and provide a backup if NAS data proves unreliable. In addition, the data would allow experts to adjust NAS estimates to account for children excluded from the NAS sample because they are not enrolled in school, attend unrecognised private schools, or do not show up on the day of the NAS assessment. Finally, we recommend that private foundations fund further research on large-scale assessments such as assessment design and optimal sampling.
One of the authors Doug Johnson is currently a part-time advisor with Convegenius Insights, an educational assessment company.
—
Footnotes:
- We are unable to distinguish between regular private and private aided schools in the ASER dataset, but private aided schools make up a relatively small portion of overall schools.
- More specifically, for states we look at the share of grade 3 students who can read at least a grade 1 level text, the share of grade 3 students who can perform subtraction, the share of grade 5 students who can read a grade 2 level text, and the share of grade 5 students who can perform simple division. For districts, we look at the share of grade 3, 4, and 5 students who can read at least a grade 1 level text and the share who can perform subtraction. We focus on these variables and years as they are only ones available and easily extractable from ASER reports.
- In our paper, we also show that sampling error and differences between cohorts are unlikely to explain this large transitory component. See Johnson and Parrado (2021) for more details.
- For example, the census assessments may help prepare students for the changes to the board exams recommended by the NEP.
- The Saksham Ghoshna campaign was launched by the state government of Haryana in December 2017 to devolve ownership and accountability to blocks for ensuring that 80% of students in each block became grade-level competent. Blocks that meet the bar are declared Saksham and felicitated.
Further reading
- Johnson, Doug and Andres Parrado (2021), “Assessing the Assessments: Taking Stock of Learning Outcomes Data in India”, International Journal of Educational Development, 84: 13. Available here.
- Kane, Thomas J and Douglas O Staiger (2002), “The Promise and Pitfalls of Using Imprecise School Accountability Measures”, Journal of Economic Perspectives, 16(4): 91-114.
- Michael and Susan Dell Foundation, CSSL, Convegenius Insights, Central Square Foundation and Educational Initiatives (2021), ‘Large Scale Assessments in India’, Report.
- Singh, A (2020), ‘Myths of Official Measurement:Auditing and Improving Administrative Data in Developing Countries’, Research on Improving Systems of Education (RISE) Working Paper 2020/042.
- Vagh, SB (2012), ‘Validating the ASER Testing Tools: Comparisons with Reading Fluency Measures and the Read India Measures’, Technical Report.
This article was originally published on Ideas for India.