The gender disparity in India’s workforce has been well-documented, and there are numerous projects and papers that analyse India’s low female labour participation. But there has been little by way of meta studies that examine public policies, programmes, data, and research across various parameters to motivate a better understanding of why female labour/workforce participation (FLWP) in India is so poor, and what can be done to change this.
As per the latest NSSO PLFS survey, the state of FLWP has worsened, and only 17.5 percent of women are part of the labour force, compared to 55.5 percent of men. In an attempt to address this, the government has actively pursued policies to increase the FLWP rate for several decades. Its approach has evolved from providing educational scholarships and reservations/quotas, to promoting self-employment and capacity building through skill training.
Still, the challenge of effective implementation, coupled with deep-rooted social norms have constrained the impact of these policies. For instance as per the most recent PLFS, 51.5 percent of women who received vocational/technical training are out of the labour force, and 10 percent are unemployed. In fact 54.8 percent of employed women are part of the informal sector, limiting their access to decent work.
The state of FLWP has worsened, and only 17.5 percent of women are part of the labour-force, compared to 55.5 percent of men.
In an attempt to improve how we understand and design policies and programmes to increase FLWP, we at Sattva Consulting, in collaboration with UNDP, undertook a meta-analysis of 13 national level databases, 58 research papers, and 53 national level policies in order to map the policy and data landscape, and derive policy implications. The primary objective of our study–Female Work and Labour Force Participation in India–was to triangulate findings from literature, policy, and data on FLWP, and establish trends, identify data gaps, and map the policy landscape.
Related article: Women, work, and migration
Decoding the falling labour participation
An oft-cited reason for the drop in FLWP has been the U-shaped relationship between education and workforce participation, which grows positively for low and very high levels of education but negatively for moderate levels of education (secondary and high-school). While India seems to exhibit the downward trend of the U-curve, its upward trend is yet to be seen. Simply, there is a lack of jobs that match the skills and ambitions of educated women. Worryingly, the combined participation rates (labour market and/or educational participation) still include only 55-60 percent of young working age women.
Another theory indicates that a significant number of women who joined the labour market in the early 2000s, did so under economic duress. But as household incomes rose, competing outcomes of the household and the labour market have resulted in women forgoing their employment. Married women substituted their own economic participation to contribute to the household economy (deep-rooted social norms, lack of agency, and gendering of occupations lead women to have little choice in this).
It is interesting to note, however, that there still exists a strong belief that when there is job scarcity, men have more right to opportunities than women. According to Pew research, 84 percent of people in India agree with this notion, higher than Pakistan (81 percent), China (73 percent), and Mexico (28 percent).
Women also might not able to move and migrate as freely as men, and face several barriers to migration when it comes to work. In the last decade, there has been only a marginal increase in the proportion of rural women working in urban areas—from about 0.22 percent to 0.46 percent.
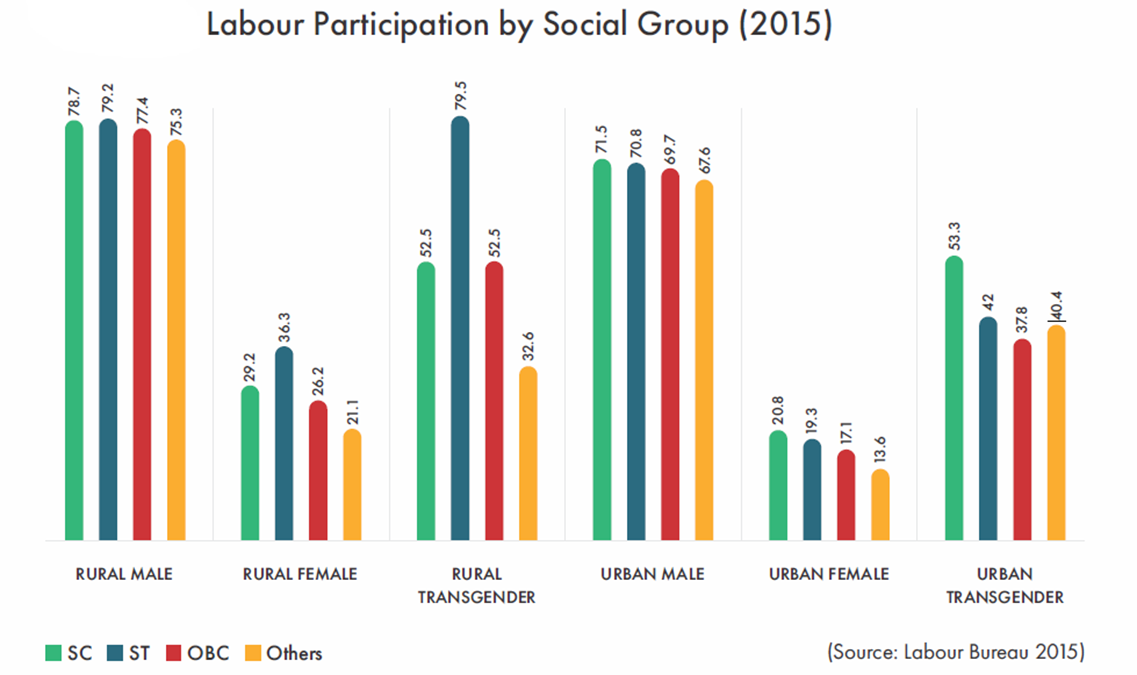
We also need to take agency into account. While many women might not possess the social support they require in order to work, many are made to work under compulsion. In India, the socio-economic disaggregation of participation rates also suggest that more disenfranchised social groups have higher rates of labour participation. So, participation rates themselves do not signal work by choice.
From Labour Bureau data, it is clear that participation rates are higher in rural areas, for trans-people, and people from scheduled tribes. Research also shows us that these groups are more likely to have jobs without written contracts, with less paid leave, and shorter periods of engagement.
The gaps in data and policy
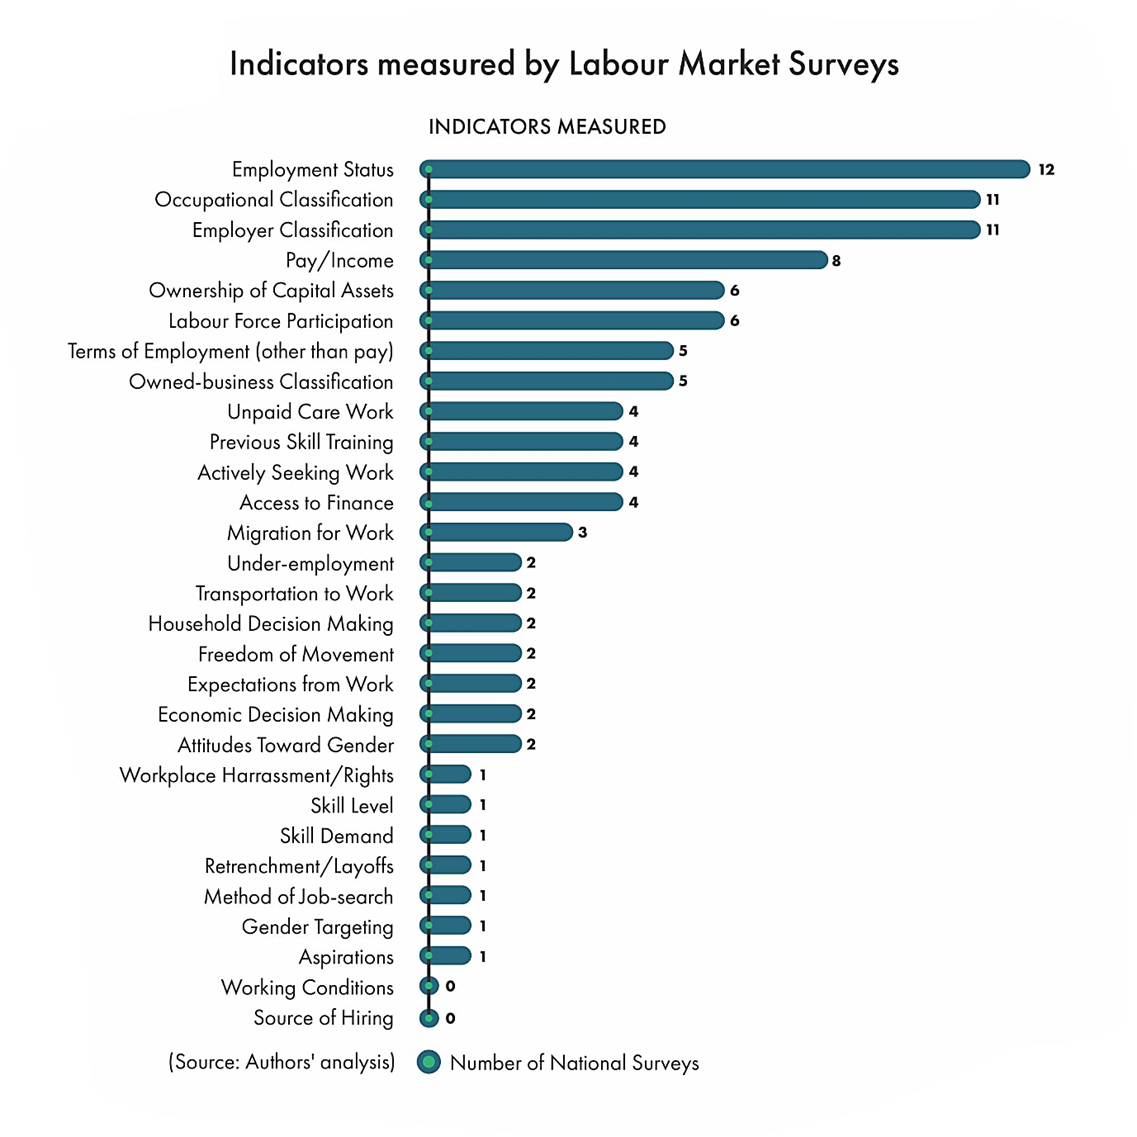
Across national surveys, a compilation of 29 metrics related to gender and the workplace emerged. While some basic quantitative indicators like employment status, type, and salary are well-measured in these datasets, fundamental qualitative indicators—such as terms of employment, working conditions, access to finance, and hiring practices—are rarely documented.
It also appears that metrics such as care work, household decision making, use of time, workplace harassment, freedom of movement, and social norms are equally rare. Another important aspect missing from national databases is behavioural and perception-based data such as career goals, aspirations, attitudes, and expectations from work.
Increasingly, the importance of support services within programmes, such as proximate services, safe transportation, migration assistance, and counselling is being highlighted, but very few schemes actively incorporate these elements into their framework. Apart from the National Crèche Scheme and MGNREGA, no livelihood schemes factor in the need for day care for the children of the targeted women beneficiaries.
Related article: As India rethinks labour rules, it’s missing one topic from the agenda
The need for inclusivity in policy design
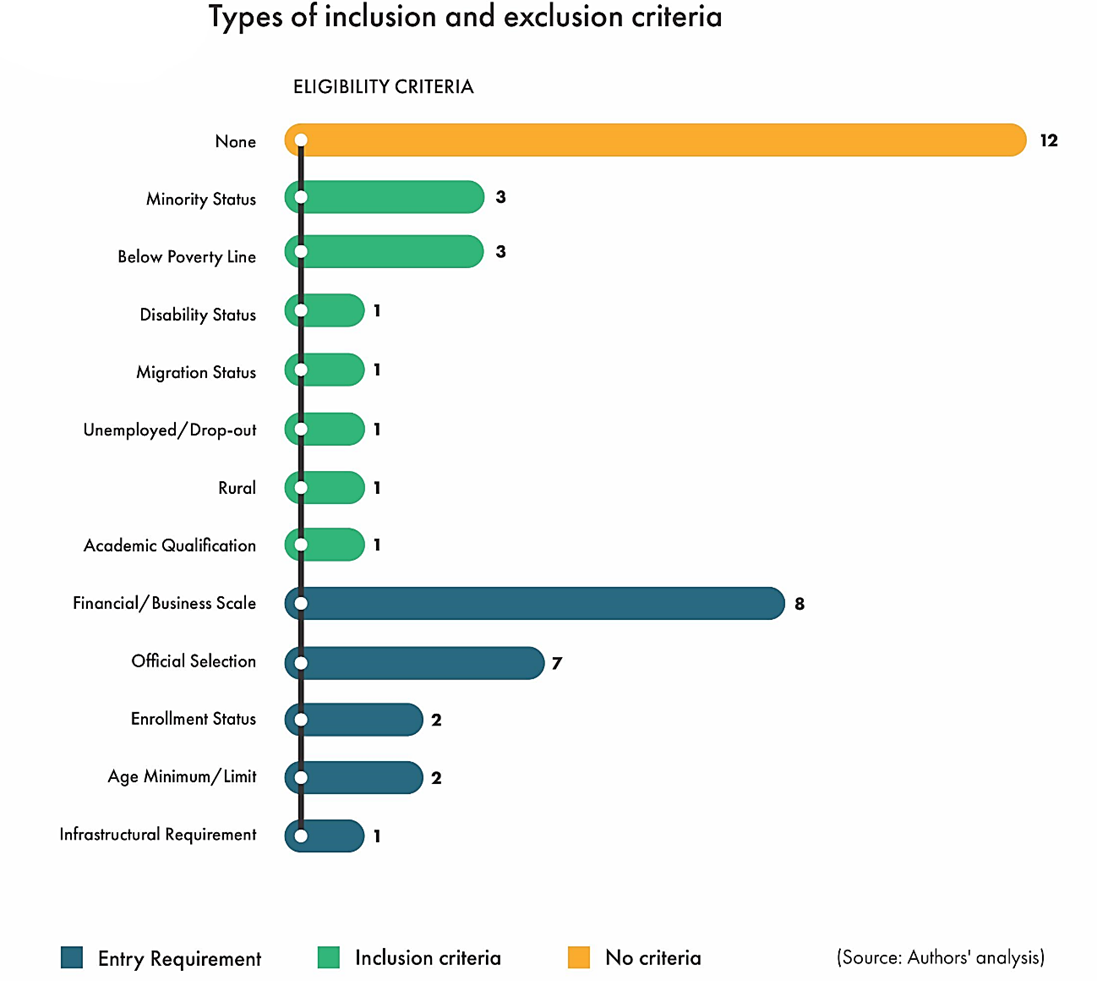
India has a well-documented history of low utilisation rates of programme funds—particularly for allocations intended for the disadvantaged. Currently, programmes seem to strive for inclusion by setting targets on total beneficiary composition, and simply ‘encourage’ inclusion, without actively being inclusive. Policies are more likely to have exclusion criteria—such as academic qualification or age limit, rather than inclusion criteria—such as minority status or drop-out status. Apart from effective targeting, inclusion needs to be practised from a delivery standpoint. Seemingly insignificant design elements often leave sizeable impact.
Currently, programmes seem to strive for inclusion by setting targets on total beneficiary composition, and simply ‘encourage’ inclusion, without actively being inclusive.
The policy analysis also finds an inordinate focus on quantifiable outcomes such as certification and placement rates. This can often prove counter-intuitive and likely perpetuate exclusion. For instance, within the Pradhan Mantri Kaushal Vikas Yojana (PMKVY) and Deen Dayal Upadhyaya Grameen Kaushalya Yojana (DDUGKY), training providers are incentivised based on their placements rates (at least 70 percent). It is likely that faced with such criteria, mobilisers will be biased to select those candidates that were more employable all along, thereby complying with the programme’s norms but implicitly excluding the neediest.
In the context of women, such an approach can further entrench gender stereotypes and feminise certain occupations. Skilling agencies will be more likely to mobilise women to take up conventionally ‘female’ roles which are either in the care economy (‘pink collar jobs’ as they are called) or in tailoring and beauty, to achieve targets with relative ease. Therefore, qualitative indicators of a policy’s success such as classroom diversity and aspiration alignment ought to be tracked as well.
How do we change the status quo?
The report summarises key policy implications and suggests recommendations, but ultimately, there needs to be a change in the way that policies are designed, implemented, and measured. Government-commissioned assessments have been sporadic and conducted using incomparable methodologies and frameworks. Some labour market schemes are not independently evaluated even when they have budgetary provisions for the same—such as in the case of the PMKVY and DDUGKY. This needs to change, along with measuring metrics beyond just the number of beneficiaries served. Good policy can create a ripple effect, resulting in gains over and beyond their mandate.


