Development impact bonds (DIBs) are an increasingly popular way to pay for social outcomes. The model is straightforward: A third-party investor takes the risk of failure from the outcome funder, losing money if the program does not meet outcomes—but earning a return if it is successful. Though the approach has built considerable momentum in the impact investing space, it is often criticized for its high transaction costs. A key cost of enabling this mechanism is setting up the data-driven systems and performance management that provide insight into a program’s effectiveness. These systems can be expensive, but they are essential to determining whether a program is on the right track, and helping it course correct if it is not. They keep the program from blindly moving forward, hoping for success but unaware of whether that is actually happening.
Dalberg is in its third year of managing the performance of the world’s largest education development impact bond—the Quality Education India DIB. The bond is enabling four education interventions—focused on EdTech, learning centres for out-of-school children, remedial education, and teacher and principal development—and serving close to 200,000 children over four years. This is an ambitious initiative, and the first of its kind to bring together a consortium of funders and education providers. At the end of the first year, three of the four interventions had met or exceeded their targets. In the second year, the intervention that did not perform was replaced by expanding an intervention that was highly successful in the first year. In addition, a new intervention was added to the portfolio as per initial plans. By the end of the second year, all four interventions had exceeded all targets—children who were part of the DIB learned twice as fast as their peers in schools without any interventions.
Related article: IDR Explains | Development Impact Bonds
The performance of this DIB was made possible by the commitment of partners all through the value chain. Our role in this four-year effort is to support service providers at different points in the initiative’s implementation, from program set-up to stabilizing their intervention to deepening activities to sustain the impact. One of the most important ways we’ve supported the DIB’s service providers has been by helping them use data to make better decisions and continuously improve their programs.
We are all enamored with bigger, better and faster data these days—and for good reason. However, if we lack a sensitivity to where and how the service providers intend to use it, this data can present unnecessary burdens on the organizations that should be benefiting from it. Our experience as the performance manager for the Quality Education India DIB has left us with four lessons on how to use data to drive continuous improvements. We’ll discuss these lessons below.
Lesson #1: Respect the starting point as much as the ending point
The promise of data systems, is, in a way, boundless: Data is always there for the taking, and it can help with everything from identifying new opportunities to understanding performance. Hence a question to ask early on is not what the perfect data system should be, but rather what kind of data system would work for a particular team. Studying how an organization currently uses data to drive decisions is a good place to start. For instance, the EdTech intervention—powered by Educational Initiatives’ personalized adaptive learning MindSpark software and deployed in Uttar Pradesh government schools by Pratham Infotech Foundation—generated lots of data. But to make successful use of that data, we needed to determine how and when it could best support the team’s work.

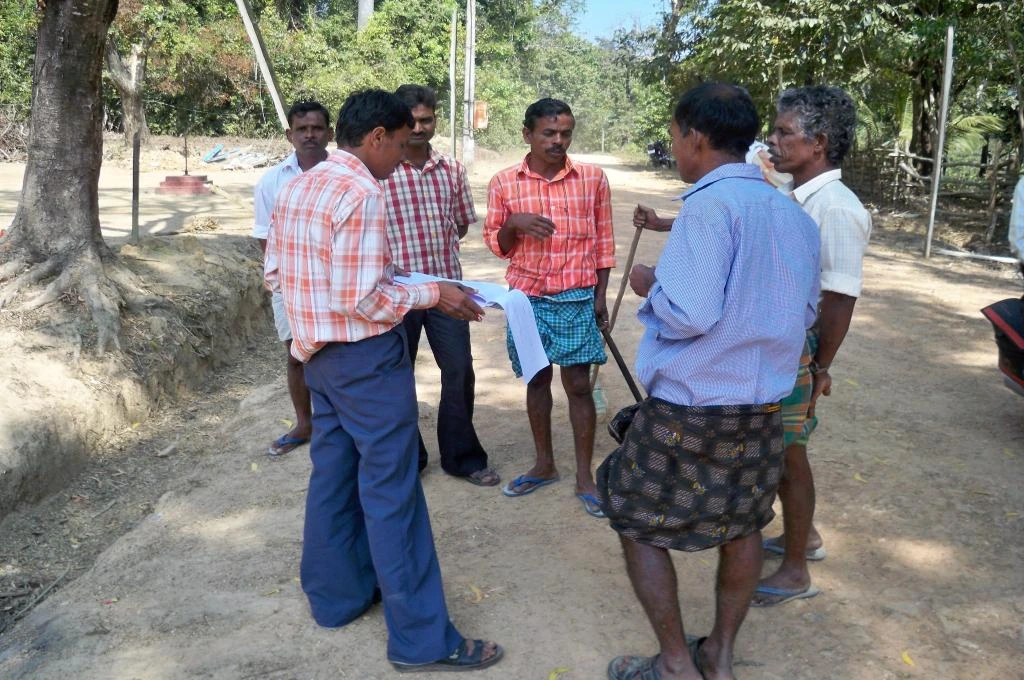
At a time when so many children cannot go to school, we need an even stronger way to determine if and how our children are learning. | Picture courtesy: Flickr
Initially, there were few improvements in the EdTech program’s performance despite the data-rich environment. In response, we met with the Pratham Infotech Foundation team that oversaw the in-school implementation support program for the software, to understand how they were using data to evaluate its performance. From the hundreds of data points available, we then picked the few that would make the most difference—we did this by focusing on key quantity metrics (e.g., number of hours of session time for students) and helping the team get familiar with them. We packaged our support in a way that sent clear signals to different stakeholders (e.g.: the computer lab coordinators were given classroom-level information, and the supervisors received information aggregated for the schools they were in charge of). Then we helped them use the information to track progress, and diagnose and solve issues (e.g.: determining which schools were not getting enough intervention time, and hence needed supervisor attention or the reallocation of laptops to ensure sufficient coverage for all students). Once the teams started using these metrics, we gradually added more nuanced indicators—including metrics for the quality of the intervention (e.g.: the percentage of questions students got right in a given timeframe, while working through the exercises in the adaptive learning software). Starting with a basic dashboard that got more robust step-by-step proved more effective than trying to build the perfect dashboard on day one.
Related article: How to get the most out of data

Lesson #2: Less is more, so consider the return on investment
In our initial work on the Quality Education India DIB, we were so focused on the program’s ambition that we overlooked the cost. In one of our early meetings with the Gyan Shala team that operates learning centres for the most marginalized children, we presented nearly 50 different indicators we wanted to track. Gyan Shala’s CEO rightfully balked at that, saying that “anything that adds time to my team adds cost, and any cost to the system needs to be fully justified.” The fact is that each indicator requires time and effort, to develop the right tools to collect that information, analyze the information, and then decide what to do with it, if anything.
We were more successful when we slowed down our enthusiasm for more data and used it to create clarifying moments for organizations.
In response, we developed a new rule of thumb: Unless a metric provides an actionable key insight, it is likely not worth it. Prior to introducing a new indicator, we have learned to make sure the service providers agree with us about its value—and to verify that they have a way to use it. We also find ways to minimize the burden of collecting and managing this data. For example, in our recent revision of the performance management tool that enables our service providers to adapt to remote learning interventions during school closures caused by COVID-19, we started with around 25 indicators that we felt were important to track. We then pushed this down to eight that we felt were critical to follow on a monthly basis (e.g.: the percentage of students completing over 50% of digitally shared worksheets—a leading indicator of student engagement). And we pushed 13 of these indicators to a quarterly schedule (e.g.: the number of children who migrated to their home villages). We also decided to drop the other metrics that were interesting but not actionable by the team. We were more successful when we slowed down our enthusiasm for more data and used it to create clarifying moments for organizations instead of information overloads.
Lesson #3: Involve field teams as much as the leadership team
Early on in our interactions with the service providers, we spoke with their leadership teams: They gave us similar feedback, asking us to listen more to their broader organizations. It soon became clear that the majority of innovations do not come from leaders dreaming up solutions, but from frontline workers experimenting daily.
Involving the frontline staff also has a payoff in terms of the quality of the data collected.
Realizing this helped us answer many of the questions we encountered—e.g.: the question of why one region was doing better than another in improving education outcomes. This type of discrepancy often had to do with what teachers in different schools were doing differently, or what unique challenges certain field team members were facing. The DIB service providers helped in this effort, by trying to document and respond to their challenges in various ways. For example, Kaivalya Education Foundation’s “Journey App” allowed its field team to document their successes and failures, which helped spread best practices. And the online rosters and implementation check-lists that Society for All Round Development created for its teacher trainers helped us monitor and address their team’s individual concerns, such as attendance and teacher motivation, which had knock-on consequences for the program. Data that provides transparency around what frontline staff are doing and how they are doing it created healthy levels of competition among organizations in the DIB, while allowing them to learn from each other.
Involving the frontline staff also has a payoff in terms of the quality of the data collected. The human psychology component here is that teams need to be incentivized to maintain overall data quality—and the best incentive is to include data that these teams can use in their day-to-day work.
Related article: Civil society and the burden of data
Lesson #4: Use soft skills alongside software skills
The three insights discussed above came from listening, and relying on our human senses rather than data. And perhaps our biggest lesson is that this kind of progress is possible when we spend less time and money on data dashboards and apps, and more on conversations with the teams. As the project has progressed, we’ve spent increasingly less time in front of our Excel sheets, and more in brainstorming sessions and workshops where the field teams have presented insights and ideas to each other. In doing so, we’ve learned that the most useful data is not always a hard number, it’s often a reflection from a team member, or an observation from a school visit that generates an insight. Having a flexible, creative approach and building trust goes further than going in with a “foolproof” plan and not taking “no” for an answer. It also allows you to be grounded in the same priorities as service provider teams, and makes the data you are capturing more relevant to amplifying their efforts. Deep listening is about more than getting buy-in: It is about having the humility to learn from those who know how things work all through the value chain.
This kind of progress is possible when we spend less time and money on data dashboards and apps, and more on conversations with the teams.
While our models were strong to begin with, it was this sensitivity towards data-gathering and the pulse checks and improvements we made along the journey that have led to the stellar performance of the DIB over the last two years. From our experience, having a lot of data to start out with is helpful but not necessary, nor is it enough in itself. This experience gives us hope that the education sector in India (especially public and low-income private schools) can benefit from a similar process, and that education delivery organizations can transform over time towards a data-driven decision-making culture.
How we gather and use data in light of the COVID-19 crisis will further challenge our thinking as we progress through the DIB’s third year. We have seen first-hand that an outcome-oriented process requires iteration and agility. At a time when so many children cannot go to school, we need an even stronger way to determine if and how our children are learning. We will continue to experiment in the weeks ahead with remote education models—for example, by testing the delivery of content through TV, WhatsApp and SMS, conducting home visits with adequate safety measures, and exploring other innovations. At every point we need to ask the same questions: Is this working—and why or why not? The last thing development programs need right now is more distraction and cognitive burdens on the people who keep them going. So as we innovate new data solutions, let us also keep listening and learning from these frontline providers on what data can do for them at every step of the way.
This article was originally published on NextBillion.