The Government of India launched the ‘Transformation of Aspirational Districts’ initiative in January 2018. With a vision of a New India by 2022, the focus was to improve India’s ranking under the Human Development Index (HDI), raising the living standards of its citizens and ensuring inclusive growth for all. The Aspirational Districts programme (ADP) identified the most under-developed among our 700+ districts. The programme provides special focus and support to accelerate the progress of these 115 districts at the bottom of our development pyramid.
Note: Districts of West Bengal decided not to join the program. Currently only 112 districts are part of ADP. However, in our analysis we cover the CSR spend across all the 115 districts that were identified at the launch of ADP in 2018.

NITI AAYOG identified 115 districts across 28 states based upon composite indicators from Health and Nutrition, Education, Agriculture & Water Resources, Financial Inclusion & Skill development and Basic Infrastructure which have an impact on HDI. In the five years of ADP implementation, the overall composite score has improved by over 72%. Maximum change has been in the areas of Education, Agriculture & Water Resources, and Healthcare.

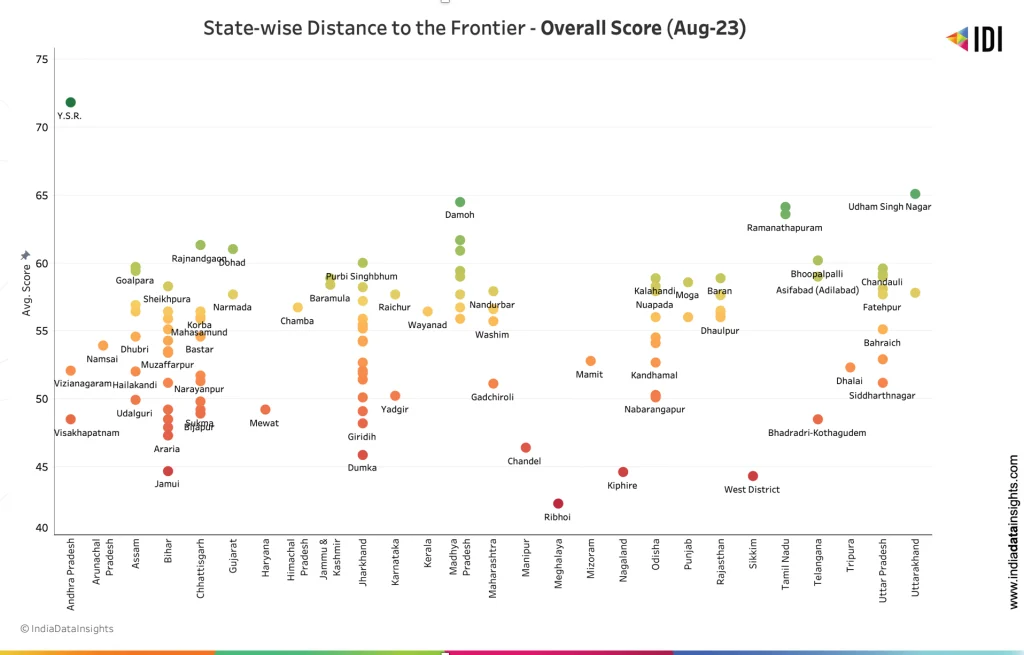
The broad outlines of ADP are Convergence (of Central & State Schemes), Collaboration (of Central, State level Officers & District Collectors), and Competition among the districts driven by a spirit of mass movement. Districts in the ADP are prodded and encouraged to first catch up with the best district within their state (districts in the frontier), and subsequently aspire to become one of the best in the country, by competing with, and learning from others in the spirit of competitive & cooperative federalism.As of August 2023, the overall composite scores of the Aspirational Districts (ADs) in the north-eastern states and a large number of ADs in the states of Bihar, Jharkhand and Chhattisgarh had an overall composite score of less than or equal to 50, they are now working towards closing the distance with districts that are in the frontier. These states also have a higher share of ADs.

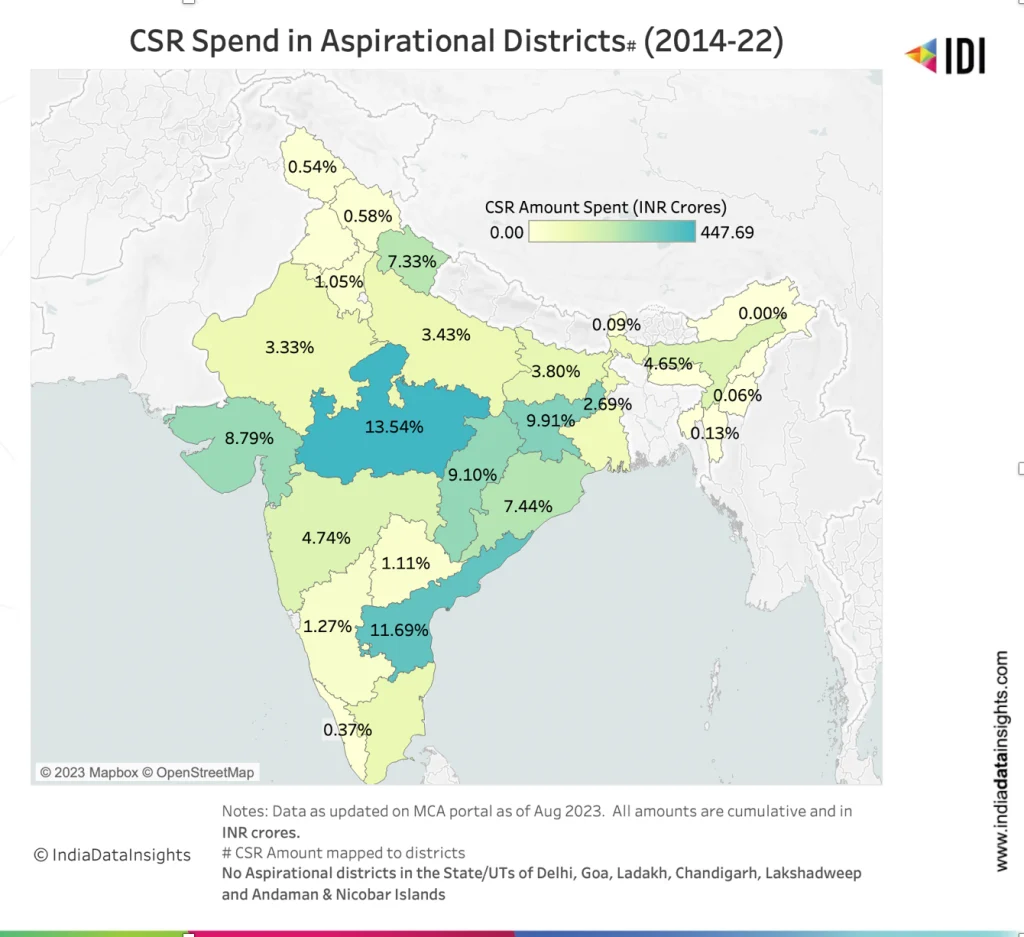
Despite the government advocating CSR investment in ADs, only about 2.15%* of the total CSR during 2014-22 has been invested in these districts, which houses more than 15% of India’s population. In FY 2021-22, CSR spend in ADs increased by more than 50% from the previous year.

More than half (53%) of the total CSR funds are spent on ADs in these five states—Madhya Pradesh (448 Cr.), Andhra Pradesh (387 Cr.), Jharkhand (328 Cr.), Chhattisgarh (301 Cr.) and Gujarat (291 Cr.).

Also, over 3/4th (78%) of the CSR spend in ADs has been across these four top sectors (Education, Healthcare, Rural Development, and Environment Sustainability). During the COVID-19 years, CSR spend in Education and Healthcare increased by more than 70%. A five-fold increase in CSR spend was seen in Environment Sustainability projects between 2020-21 and 2021-22.

In Jan 2023, five years after the launch of ADP, the government of India launched ‘The Aspirational Blocks Programme (ABP)’. This Programme focuses on improving governance to enhance the quality of life of citizens in the most difficult and underdeveloped blocks of India.500 blocks from across 27 states and 4 Union Territories of India were identified to steer and drive the change in aspirational blocks by monitoring key socio-economic indicators categorised under major sectors such as Health and Nutrition, Education, Agriculture and Allied Services, Drinking Water and Sanitation, Financial Inclusion, Basic Infrastructure, and overall Social Development. With the launch of ABP, more than 45% of districts in India (~350 districts) are now either part of ADP and/or districts of ABP.

How have the 115 ADs transformed across various thematic areas in the last five years? Which districts have been consistently improving across all thematic areas? How much CSR funding have they received? Which companies are funding these ADs? How do we strengthen investments at the bottom of our pyramid and help these districts reach their transformation goals? Does a 2% allocation of the total CSR investment suffice to facilitate the transformation of aspirational districts?
To know more about ADP & ABP and CSR Spend in ADs and districts of ABP, explore our data assets on Aspirational Districts.
*According to the direct attribution to districts available on MCA CSR portal—a large chunk of CSR remains unattributed to any particular district.
This article was originally published on India Data Insights.
This article was updated on 17th January, 2024 to include a note on the districts that were considered for the analysis.


