Life Below Water is the 14th SDG listed by the United Nations and focuses on the conservation and sustainable use of oceans, seas and marine resources for sustainable development. Based on current progress, India ranks 70th in the world for Life Below Water and is moderately improving in terms of our conservation efforts.

Coastal protection
Ensuring Life Below Water begins with protecting marine areas. In India, this is achieved through the Marine Protected Area (MPA) network, which has been used to manage natural marine resources for biodiversity conservation and the well-being of the people dependent on them. While India has identified 129 MPAs, this accounts for less than 0.3% of the total geographic area. 26% of the total Indian MPA lies in West Bengal.

India’s mangrove cover has been steadily increasing in the last two decades. About 493 Sq. Kms. of mangrove has been added to the coasts for India since 2001.


Water quality
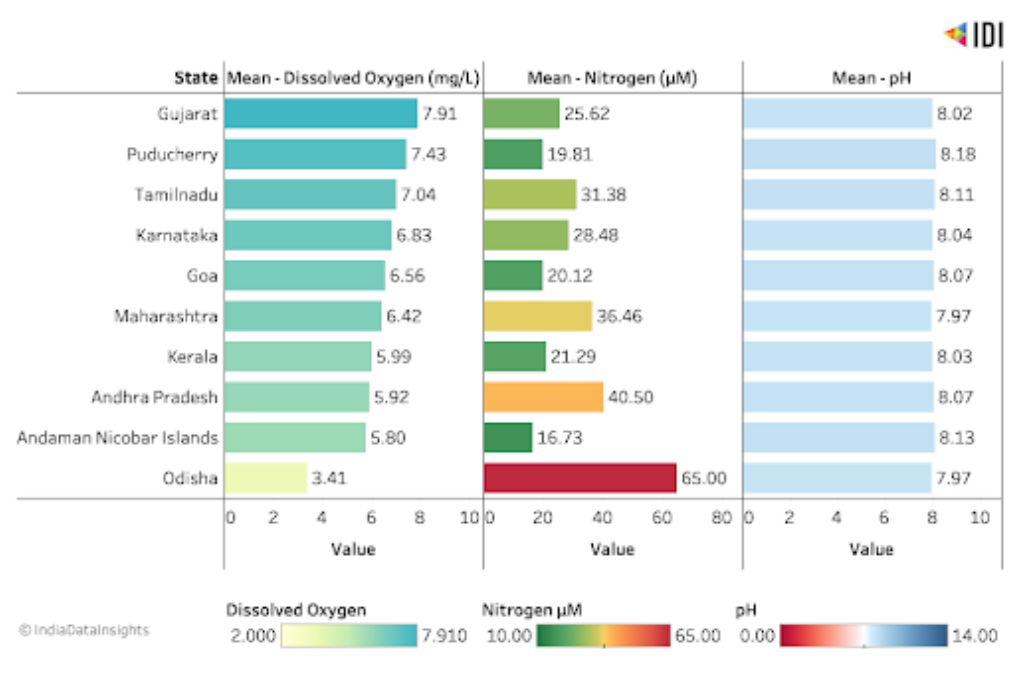
Alongside protecting coastal environments, ensuring quality water in coastal waters and rivers can help improve Life Below Water. Three important parameters which determine the quality of seawater are—dissolved oxygen, nitrogen content and pH of the Water. In India, Odisha has very low levels of dissolved oxygen at 3.41 mg/L and extremely high levels of Nitrogen, 65 μM. This combination of low dissolved oxygen and high Nitrogen presents a big threat to the regions marine ecosystem.
Quality of sea water at coastal area (at Shore < 1Km)—Peninsular India & islands (2020)
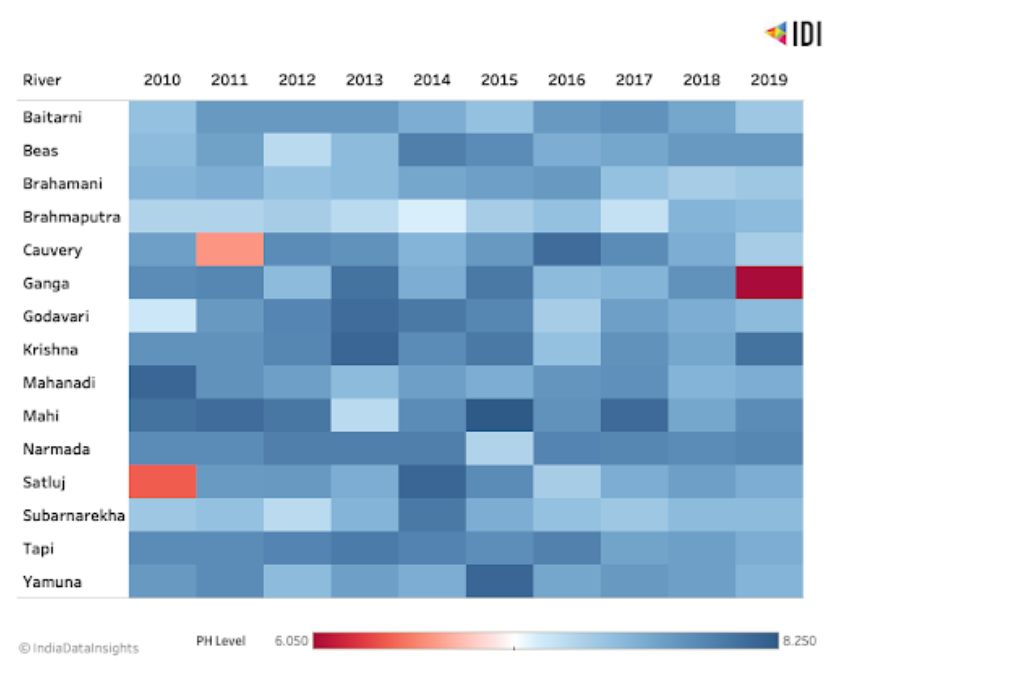
In Indian rivers, a pH value in the range of 6.5-8.5 is considered safe for living organisms, with many aquatic organisms and plants adapting to specific water pH. The Central Pollution Control Board data shows that in 2019, water in river Ganga was acidic with an average pH value of 6.05 (min 2.2–max 9.9) while river Krishna had an average pH value of 8.25 (min 6.6–max 9.5), making it very alkaline, and harmful to aquatic life.
Aquaculture & fishing
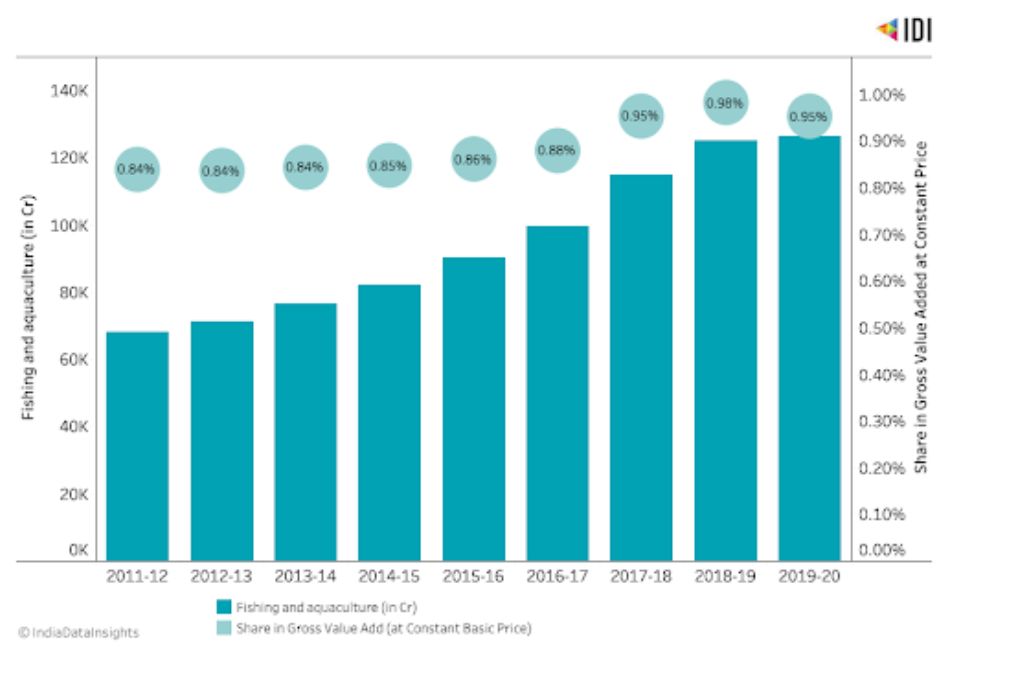
Sustainable fishing is critical to ensuring life under water. In 2011-12, at constant basic price, share of Fishing and Aquaculture in India’s GVA (Gross Value Add) was only 68,027 Crores. However by 2019-20 this had increased to 1,26,370 Crores—85% increase. As of 2019-20, this industry constitutes 0.95% of India‘s total GVA, a 40% increase since 2011-12.
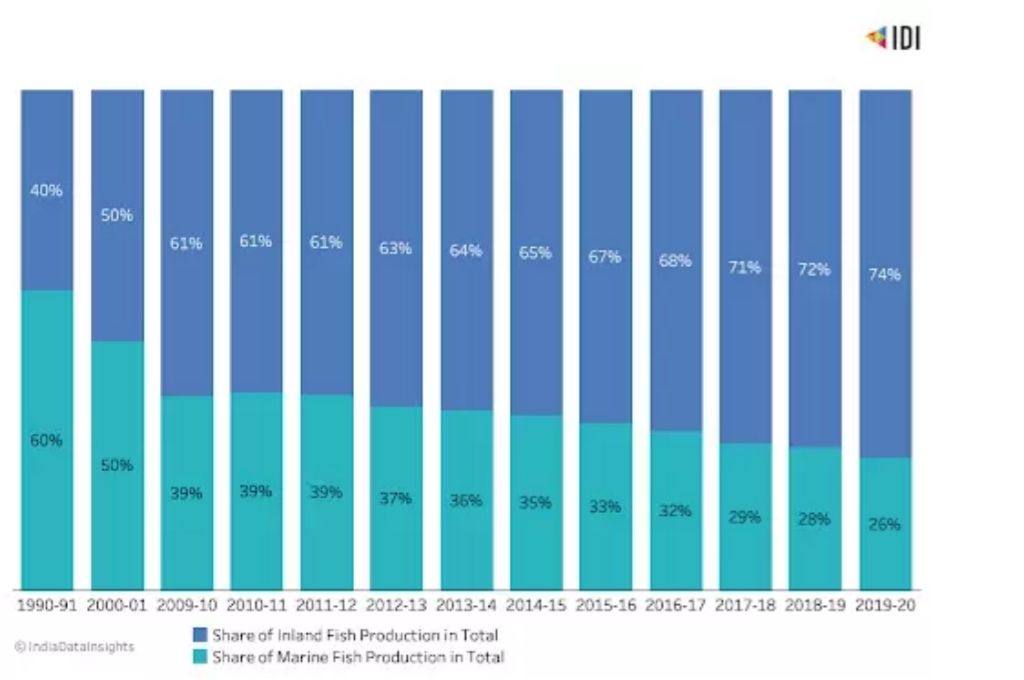
The significant growth in Fishing and Aquaculture share is a result of India becoming the 2nd largest fish producing country in the world, with 7% of the world’s total fish production coming from India. In 2019-20, India produced 14,164 thousand tonnes of fish, with 74% coming from Inland fisheries and 26% from marine fisheries. However, despite a 250%+ increase in fish production, the share of marine fish production has declined. With India’s Fishing and Aquaculture industries booming, it’s more important now than ever to ensure our institutions continue to regulate the usage of coastal areas and ensure sustainable fishing practices to ensure we meet our SDG 14 goals.
Corporate contributions
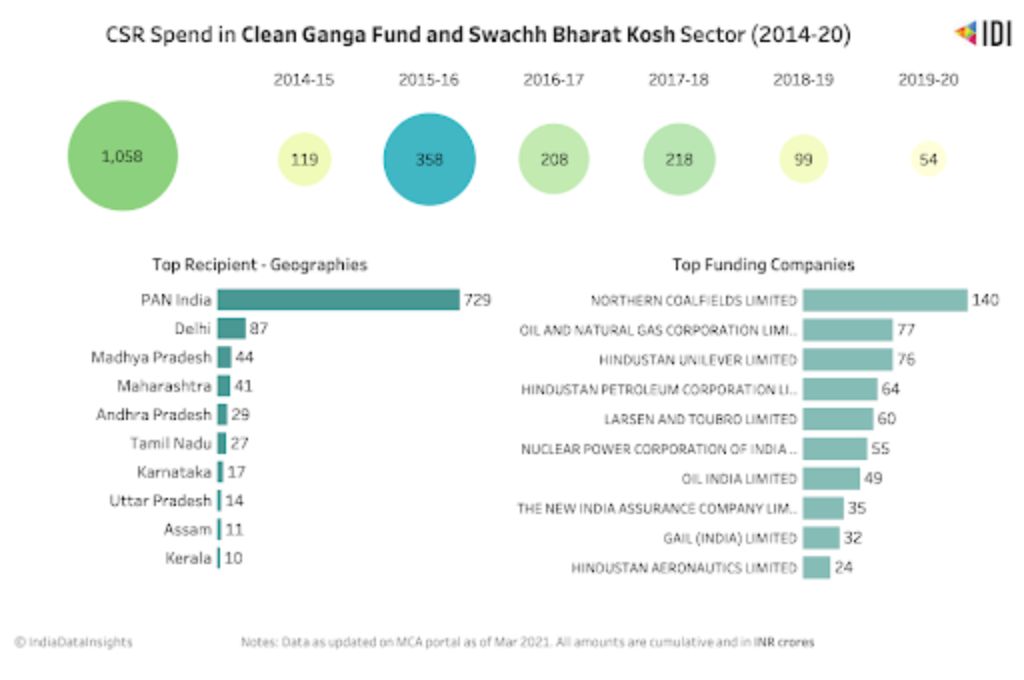
Although SDG 14 aims to conserve and sustainably use the oceans, seas and marine resources for sustainable development, we believe quality of river water too plays an important role in preserving marine life. Projects related to Clean Ganga and Swachh Bharat Kosh are some of the sectors where corporates are spending their CSR funds. Over the last 6 years, a total of 1,058 INR Crores has been contributed to these sectors. The largest share of funds was contributed in 2015-16—358 Cr (34% of the total amount spent in these sectors). Higher skew towards PSU seem to be major contributor in these areas.

For more data assets on SDG 14 – Click here
This article was originally published on India Data Insights.