For all of independent India’s recorded history, a majority of the workforce in the country has been self-employed. However, it is only in the past few years that self-employment has been touted as an answer to India’s employment challenge.
India’s previous (interim) finance minister, Piyush Goyal, even claimed that job losses are a good sign, as today’s youth prefer to be job creators rather than job seekers. Prime Minister Narendra Modi famously referred to pakoda sellers when an interviewer asked him about job creation in the economy ahead of the 2019 Lok Sabha polls.
Only 4% of the self-employed are job-creators while the rest run small enterprises.
Till the Periodic Labour Force Survey (PLFS) of 2017-18, official employment data did not capture earnings of the self-employed. The PLFS for the first time has captured such earnings and the picture isn’t pretty. Most of India’s self-employed are not job creators, contrary to claims made by several ministers over the past few years, and have poor earnings.
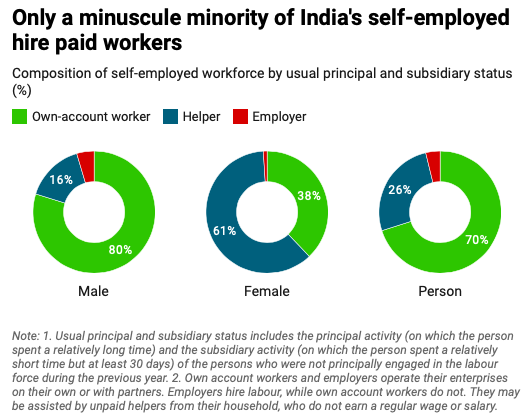
As much as 70% of the self-employed were own account workers, an official categorization of self-employed workers who run their own establishment or enterprise (with or without partners) without hiring any worker, while 26% were unpaid helpers who assist household members in running their enterprise, but do not receive any regular wage or salary. Only 4% of the self-employed were employers (who run their enterprise by hiring workers).
Source: Authors’ calculations using PLFS 2017-18 unit-level data
The latest data has a silver lining though. Between 2011-12 and 2017-18, there was a rise in the share of own account workers (7.3 percentage points) and employers (1 percentage point) among the self-employed and a fall in the share of unpaid helpers, which can be considered a positive development. To ensure comparability with the earlier survey, only the data from the first visit of the PLFS has been used here.
Related article: Labour market effects of workfare programmes: Evidence from MGNREGA
A majority of the self-employed (60%) were engaged in agriculture. Most of those engaged in non-agricultural activities were in trade, manufacturing, transport and storage.
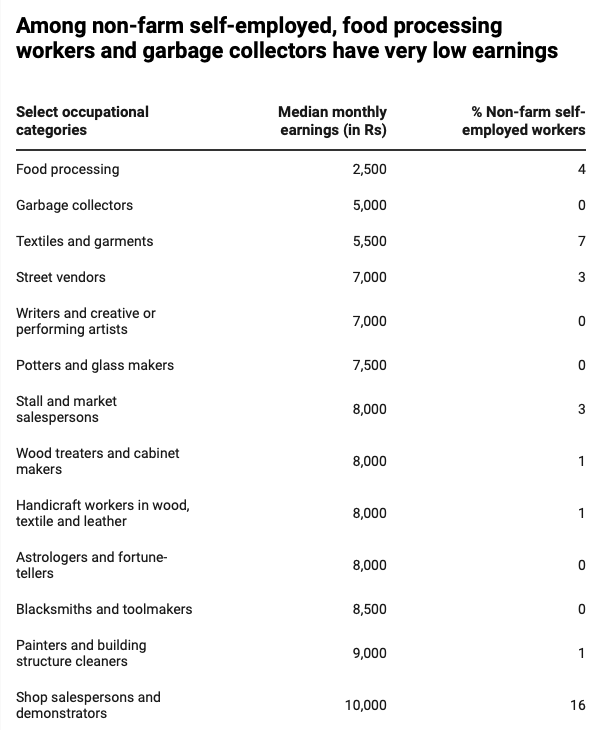
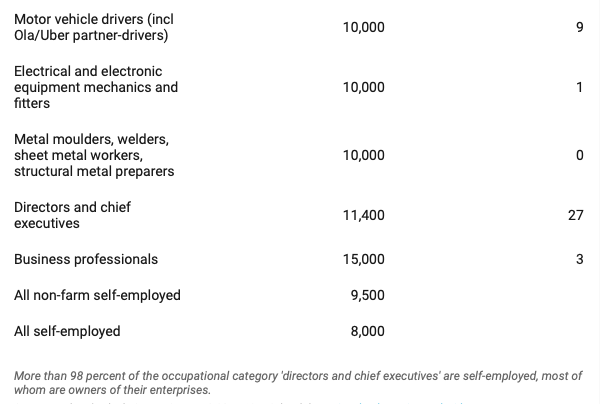
The data showed that motor vehicle drivers were among the better-paid workers within the self-employed with median reported earnings of ₹10,000. This includes Uber and Ola drivers, who are captured in official statistics, contrary to what some NITI Aayog officials believe.
The median reported earnings of astrologers and fortune-tellers (₹8,000) was lower than that of drivers but higher than that of food processing workers (₹2,500), textiles and garments workers (₹5,500), and street vendors (₹7,000). It is worth noting that these earnings are self-reported and hence may suffer from under-reporting.
Source: Authors’ calculations using PLFS 2017-18 unit-level data
The median reported earnings of own-account workers was ₹8,000 per month, while that of employers was almost double at ₹15,000.
However, as noted earlier, employers constitute a very small proportion of the self-employed. The median monthly earnings for all self-employed workers was ₹8,000. This is lower than the median earnings of regular workers in the country.
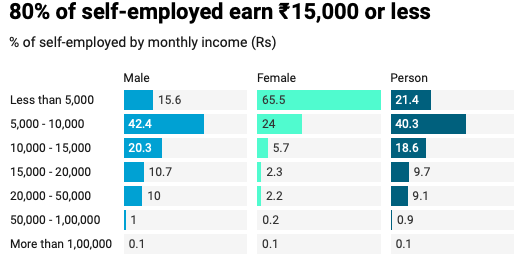
Only about 10% of the self-employed reported earnings more than ₹20,000 per month and only about 1% reported earnings more than ₹50,000 per month.
Source: Authors’ calculations using PLFS 2017-18 unit-level data
Median earnings from self-employment was 1.5 times higher in urban areas than in rural. More striking is the gender earnings gap in self-employment—the median earnings of men was 2.5 times higher than that of women.
Related article: The missing women in finance
The median monthly earnings of self-employed women was ₹3,000 in rural areas and ₹4,000 in urban areas. This was lower than the earnings of casual women workers in both these areas. A whopping 65% of women engaged in self-employment earned less than ₹5,000 per month, and 90% had monthly earnings of less than ₹10,000.
More than half of Indian workers are engaged in self-employment and most of them operate on a very small scale as unpaid helpers in their family enterprises.
This is partly driven by the skewed gender pattern of self-employment. The categories of own account workers and employers, who are largely responsible for decision making, were dominated by men whereas women were a majority among unpaid helpers.
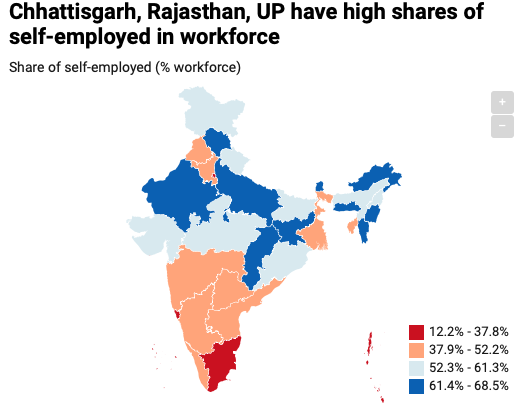
The share of the self-employed in the workforce remained stagnant between 2011-12 and 2017-18 at 52.2%, the data showed. However, the workforce itself shrank over this period, and the share of the self-employed in the total population declined by 2 percentage points. Among major states, the shares of the self-employed in the workforce was high among some of India’s poorest states: Chhattisgarh (66%), Rajasthan (65%), Uttar Pradesh (64%), and Jharkhand (61%).
Source: Authors’ calculations using PLFS 2017-18 unit-level data
In contrast, the shares of the self-employed were relatively lower in some of India’s most prosperous states: Tamil Nadu (33%), Kerala (38%), Haryana (44%), and Andhra Pradesh (45%).
Most self-employed enterprises (89%) were small ones, with less than six workers (hired or family members). Only about 3% of enterprises had more than 10 workers.
On the whole, more than half of Indian workers are engaged in self-employment and most of these self-employed workers operate on a very small scale without hiring workers or as unpaid helpers in their family enterprises.
The average reported earnings of the self-employed, particularly the women among them, is extremely low. This large section of the workforce is also bereft of job security.
The data shows that India’s self-employed are a precarious and vulnerable lot. The job creators among the self-employed are few and far between.
This was originally published on Livemint. You can read it here.


