Several years ago, we had a project discussion with a large organisation working on menstrual hygiene. The organisation had just signed an MoU with a state department to roll out its programme across all secondary government schools. There was excitement about the opportunity to scale—a validation of years of community-led work centred on adolescent girls. The CEO wanted systems in place to monitor programme quality, catch issues early, and adapt quickly. But as planning progressed, funding proved tight, and the first thing to be cut was the monitoring, evaluation, and learning (MEL) budget. “We’ll manage with Google Sheets and spot checks,” the CEO said, reluctantly.
The situation is all too familiar. It is not that organisations don’t want to learn from their work. It is that documenting outcomes is often seen as something that comes after programme design, rather than being integral to it. Nonprofits want to measure impact, and donors want evidence of it. But both often overlook a more fundamental question: what is the risk of not having the right data?
The hidden cost of messy data
Slashing the MEL budget may feel like saving money. In reality, it can end up costing organisations far more. Field teams fill in survey after survey, taking time away from working with communities. Leadership spends hours making sense of data instead of thinking strategically. And when decisions are made without reliable evidence, there’s no way of knowing if they’ll lead to the desired outcome, or whether there could have been a better way to solve the problem.
We worked with a child welfare organisation for more than two years as it set out to solve these challenges. The organisation was implementing multiple interventions for children, youth, and staff in child care institutions (CCIs), including training, educational programmes, and gadget allowances. Additionally, in many instances, other agencies were providing complementary support. With several interventions operating simultaneously, measuring the effectiveness of a particular programme and using it to improve design or implementation proved difficult.
Another challenge the organisation faced was using its existing data to inform career support for young people in the CCIs. Its placement records captured basic details, such as job titles, employers, and salaries, but offered little insight into the wider labour market. Effective career counselling would require an understanding of young people’s aspirations, regional employment trends, and emerging sectors. For example, a counsellor could offer much more focused guidance by demonstrating to a young person in Madhya Pradesh that the local tourism sector was growing, share information about the salaries offered by specific entry-level roles, as well as long-term career growth prospects. However, without access to such information, the programme team had to instead rely solely on their own ground experience and existing knowledge.
To bring these fragmented streams of information together to generate usable, actionable insights, the organisation decided to build a centralised customer relationship management (CRM) system. However, glitches emerged early on. Data entry requirements to complete each request were excessive, records were sometimes mapped to the wrong child, children and young people had different identification numbers across programmes, and not enough time had been spent on defining decision logic.
Most damaging of all, the team lost trust in the data itself.
Maneuvering around fragmented and incorrect data became a significant challenge. At one point, an exhausted programme lead confessed she wished she could have the manual system back. Bulk uploads and a new approval process were so cumbersome that she often found herself unable to approve fund requests, since she could not see how much of the available budget had already been allocated.
Having already invested significantly in the system, the organisation decided to keep fixing it. With each error, the system’s external vendor tried a new patch. Sometimes it worked, while other times it broke another part of the workflow.
While the impact was clear to some extent—measured in the number of hours spent reviewing and cleaning data, or budget spent on bug fixes—the true cost of this decision was much less visible and thus never quantified. Major strategic decisions, such as what additional support young people needed to successfully secure jobs, or which skilling institutions to partner with, were made on gut feel rather than evidence. Promising funding opportunities slipped away due to a lack of verifiable impact data. Most damaging of all, the team lost trust in the data itself.

The alternative is not more, but better data
Compare this with an organisation making traditional Indian art and music accessible to children from low-income families. Like many nonprofits, it regularly faced the funder’s classic question: “So what?”
Instead of investing in complex assessments of cognitive development, the organisation focused on two simpler questions. If children genuinely enjoyed the experience and eagerly awaited the artists’ return, didn’t that say something about the programme’s value? If teachers and parents shared stories about the changes they saw, wasn’t that also part of understanding its impact?
For nonprofits, clarity starts with knowing not just which data points to track, but why.
The organisation closely tracked a small set of metrics: session quality, student engagement, and the variety of art forms presented. Regularly reviewing these immediate indicators gave the team an early-warning system, which they used to plan upcoming sessions, and to act quickly whenever feedback dipped below their benchmark. If engagement dropped at a specific school, they could adapt session content and have focused conversations with artists to address issues as they arose, rather than waiting for an end-of-quarter evaluation.
Within a year, the organisation had increased its budget by 70 percent, experimented with new programmes, and expanded to more schools. Looking back, the founder explained that the real value did not lay in a dashboard for funders, but in the operational agility to know what was happening across schools and to revise and improve the programme in real time. This is also what ultimately signalled credibility.
For nonprofits, clarity starts with knowing not just which data points to track, but why. Messy data manifests as unused survey findings, bloated approval processes, or metrics that capture neither the intent nor the true scope of work. Without dedicated, well-aligned MEL resources or systems, these hidden drains remain difficult to identify—and even harder to fix.
Here are some practical steps we’ve seen nonprofits take to improve their data monitoring and evaluation capacities:
1. Budget for MEL as an earmarked percentage
Most guidance converges on setting aside five to ten percent of the total project budget for MEL. International organisations such as UNDP, Oxfam, and Save the Children also recommend three to seven percent. This share shifts with the level of complexity, such as project scale, geographical reach, or specialised evaluation needs. Practitioners at London Youth’s 2025 Festival of Learning also argued that once staff time spent on collecting and processing data is included, the actual figure for MEL funds would be closer to 20 percent.
The number matters less than the habit. Determine MEL needs before the rest of the budget is locked, not after.
2. Remember that MEL is mostly about people, not software
A typical MEL budget includes staff time, data collection, systems, training, evaluation, and reporting. Yet founders often think of MEL primarily in terms of technology purchase. When these investments fail, the problem is rarely the technology alone. Usually, insufficient time went into aligning the system with the people and the purpose. As seen with the child welfare organisation, investing in a custom CRM without first aligning system workflows with staff capabilities led to widespread data errors and team fatigue.
If the choice is between a fancier system and a person who can help you use the one you already have, choose the person. A system can be upgraded later; institutional knowledge needed to interpret and use data is much harder to rebuild once lost.
3. Don’t let MEL be dismissed as “overhead”
When a funder categorises MEL as an administrative cost, come prepared to explain why it is integral to project-related work. India’s CSR rules cap administrative overheads at five percent of expenditure. However, these are defined narrowly as general management of a company’s CSR function, explicitly excluding costs incurred for designing, implementing, monitoring, and evaluating a project.
Moreover, the instinct to treat MEL as overhead or to find it difficult to justify to funders is also understandable. Unlike a training session, it may not produce an immediate, visible beneficiary outcome. But MEL is no more unnecessary ‘overhead’ than a map on a road trip. You need to know whether you are heading in the right direction, and when it is time to change or correct course.
4. Make the hidden costs visible
Unlike the Cost of Poor Quality frameworks that are used to identify defects in manufacturing, there is no standard “cost of messy data” calculator for nonprofits. What organisations can do instead is a simple self-audit, tallying: :
- hours spent each month cleaning data;
- hours field staff lose to redundant surveys;
- decisions delayed for lack of evidence; and
- proposals not pursued for lack of measurable impact.
Then ask what this has cost the organisation. The number doesn’t need to be precise. The exercise itself makes something that is usually invisible, visible to leadership and boards.
5. Start measuring what you will use
A recent Dasra-Sambodhi study of 175 Indian civil society organisations found that, out of every 100 data points collected, 73 are used for donor reporting, while only 18 supported internal decision-making. Organisations spend field time collecting data that travels upward to satisfy reporting requirements, but it rarely travels back down to help teams make better, more informed decisions.
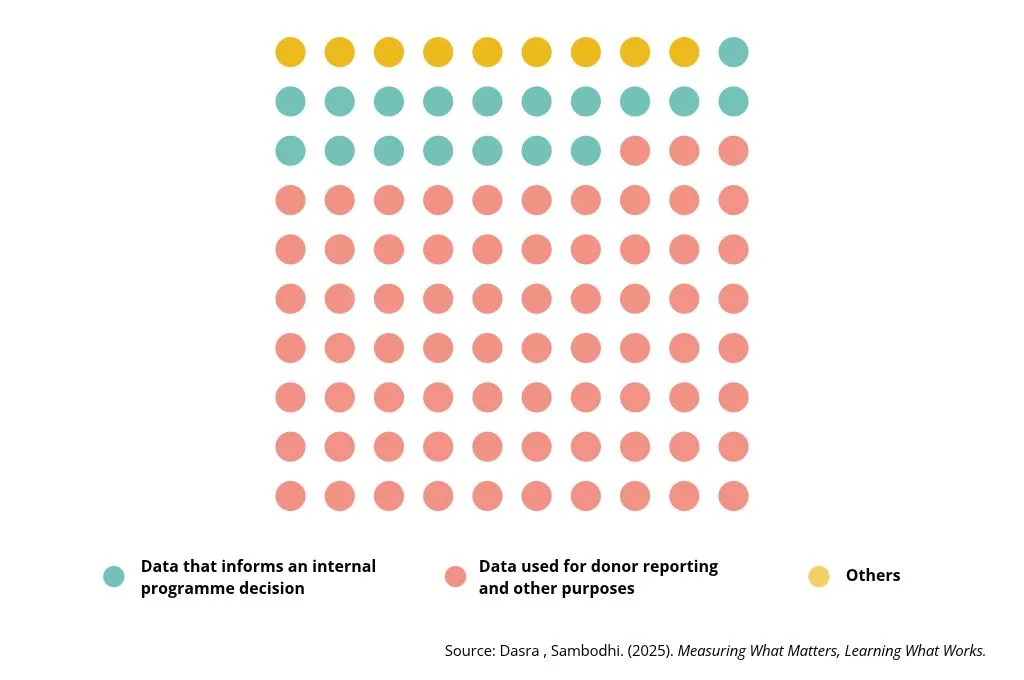
The arts organisation referenced earlier did the opposite. Instead of collecting broad datasets, it tracked just three operational indicators—session quality, student engagement, and the variety of art forms presented—and built daily routines to act on them.
Before adding any new indicator to your system, ask: ‘Who will look at this information, and what specific decision will it change?’ If there is no clear answer, collecting that data isn’t just unnecessary; it carries a real, hidden cost.
The real cost is lost learning
Data becomes unreliable not just through software glitches, but also through organisational disconnect: when field teams input numbers without understanding their purpose, when duplicate records distort the bigger picture, or when missing entries turn strategic discussions into arguments over who did not fill out a form. Ultimately, the focus shifts away from understanding what the numbers actually reveal. No invoice says, ‘INR 5 lakh lost because the team spent six months fixing the wrong data.’ No budget line captures a decision that was never made. No report records the funding opportunity missed because the organisation couldn’t produce credible evidence quickly enough. These hidden costs accumulate quietly, leading to a deeper institutional risk. When teams repeatedly encounter patchy, inaccurate, or conflicting figures, they lose confidence in data altogether and revert to deciding based on instinct and anecdote alone. That is the moment a data problem becomes an organisational one.
The answer isn’t to build the perfect dashboard, buy the most sophisticated CRM, or collect more data. It lies in asking: What specific decision will this information drive, and what is the simplest system that can answer this question reliably?
For nonprofits, every rupee spent on a programme carries an implicit promise: that we will use it as well as we possibly can. Good data is part of keeping that promise—to ourselves, to our funders, and to the communities we serve.
—
Know more
- Understand the importance of defining and measuring programme impacts from communities’ perspectives.
- Learn more about what constitutes an M&E budget.
- Read more about the hidden costs of monitoring, evaluation, and learning.